Destination Earth Use Case
Addressing urban heat island effect


Information
Company: VITO
Destination Earth Use Case DE_370e_VITO
Use Case Overview
In recent years, climate change has been causing increasingly frequent and intense heatwaves in Europe. Climate projections indicate that the population exposure to extreme heat will rise by more than an order of magnitude towards the end of the century. Cities are especially at risk because of the urban heat island (UHI) phenomenon, which causes a much higher exposure to heat stress for citizens compared to rural areas.

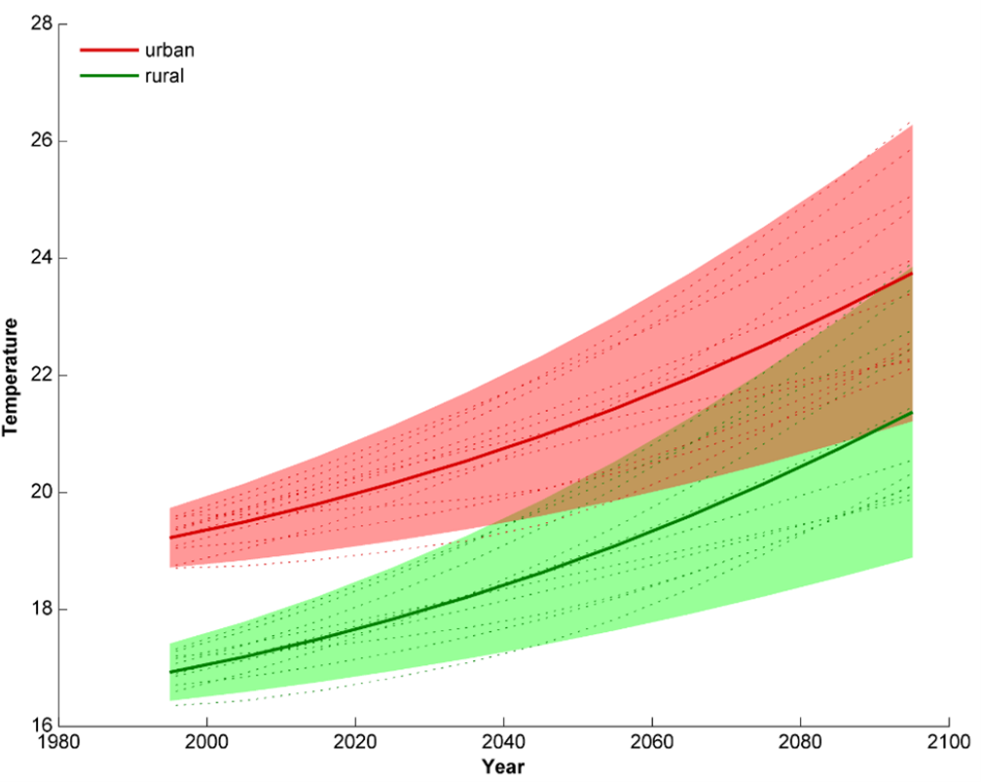
Projected average summer air temperatures [°C] for the city of Antwerp under the RCP8.5 climate scenario. Source: VITO.
Projected average summer air temperatures [°C] for the city of Antwerp under the RCP8.5 climate scenario. Source: VITO.
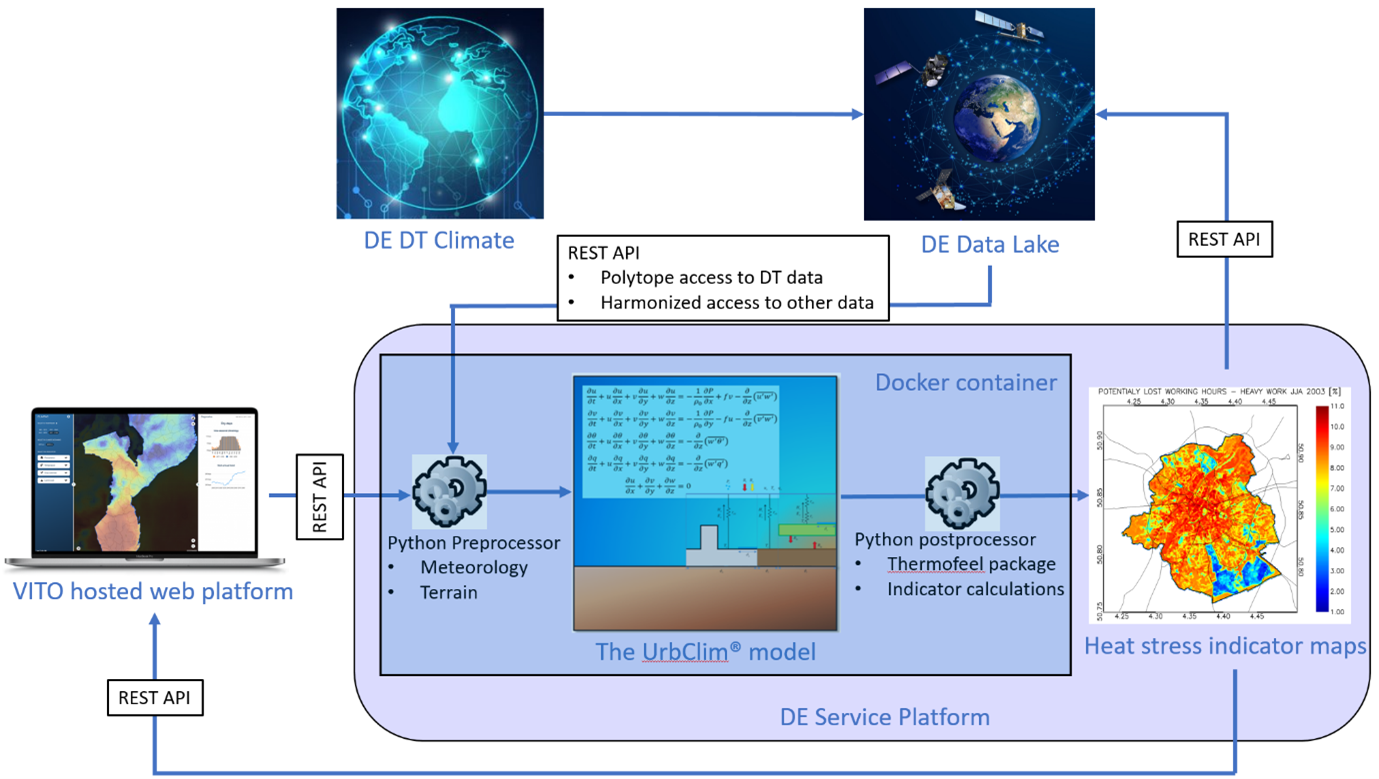
In this context, this use case intends to provide high-resolution urban heat maps for cities across Europe to underpin and motivate urban climate adaptation measures that are being developed. The urban heat maps will be generated by means of a physics-based high resolution urban climate model, UrbClim, nested within large-scale atmospheric output provided by state-of-the-art global climate models in the DestinE Digital Twin platform. UrbClim will downscale the global climate model results for selected urban areas based on detailed terrain data, providing air temperature and thermal comfort indicators at a spatial resolution of 100m.

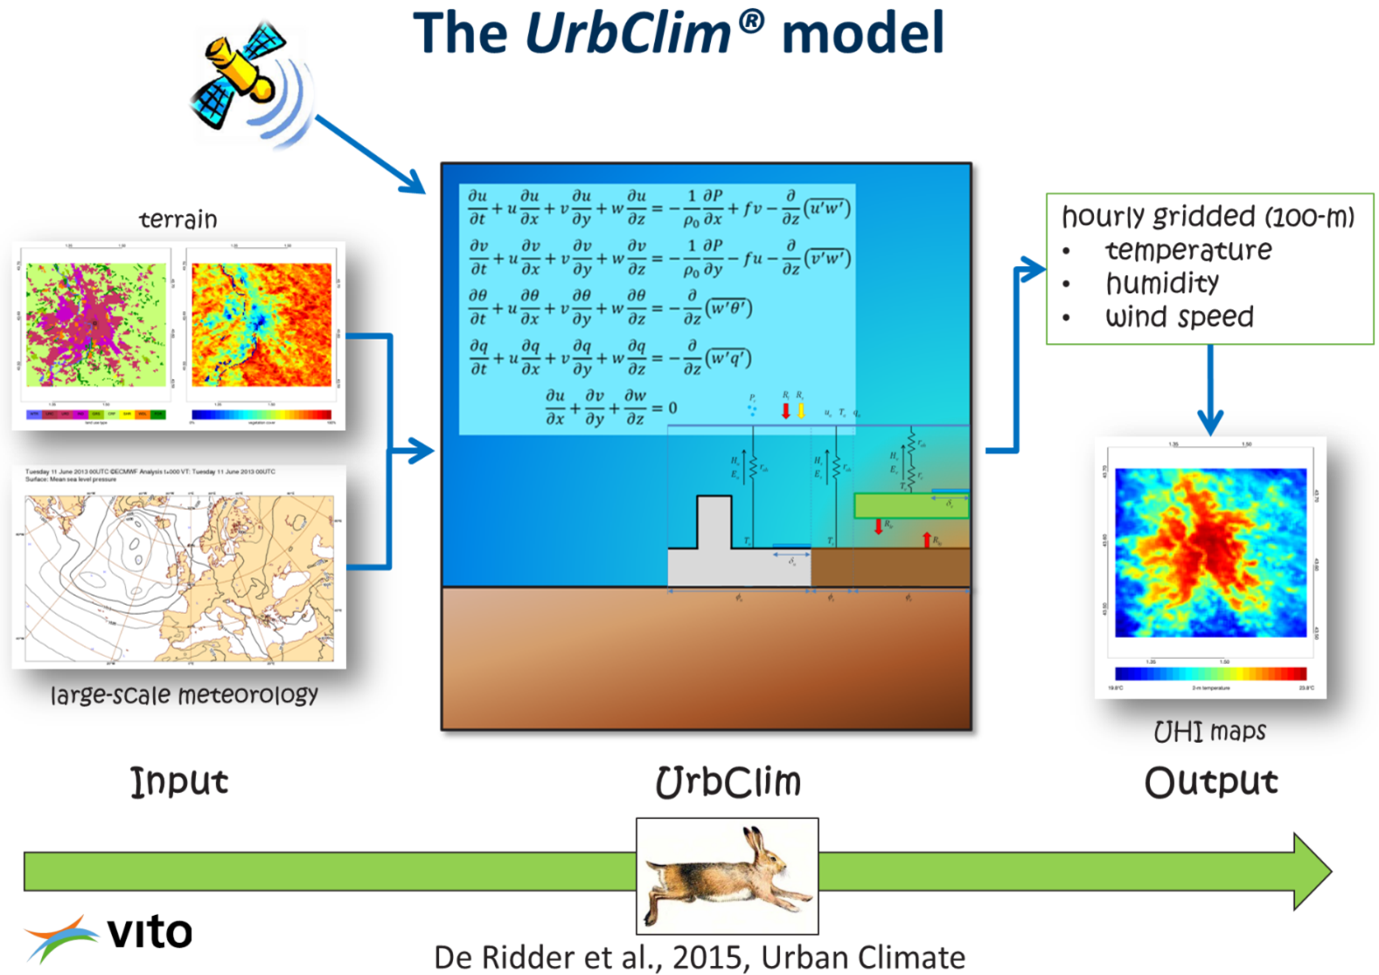
Schematic representation of the UrbClim model. Source: VITO.
Schematic representation of the UrbClim model. Source: VITO.

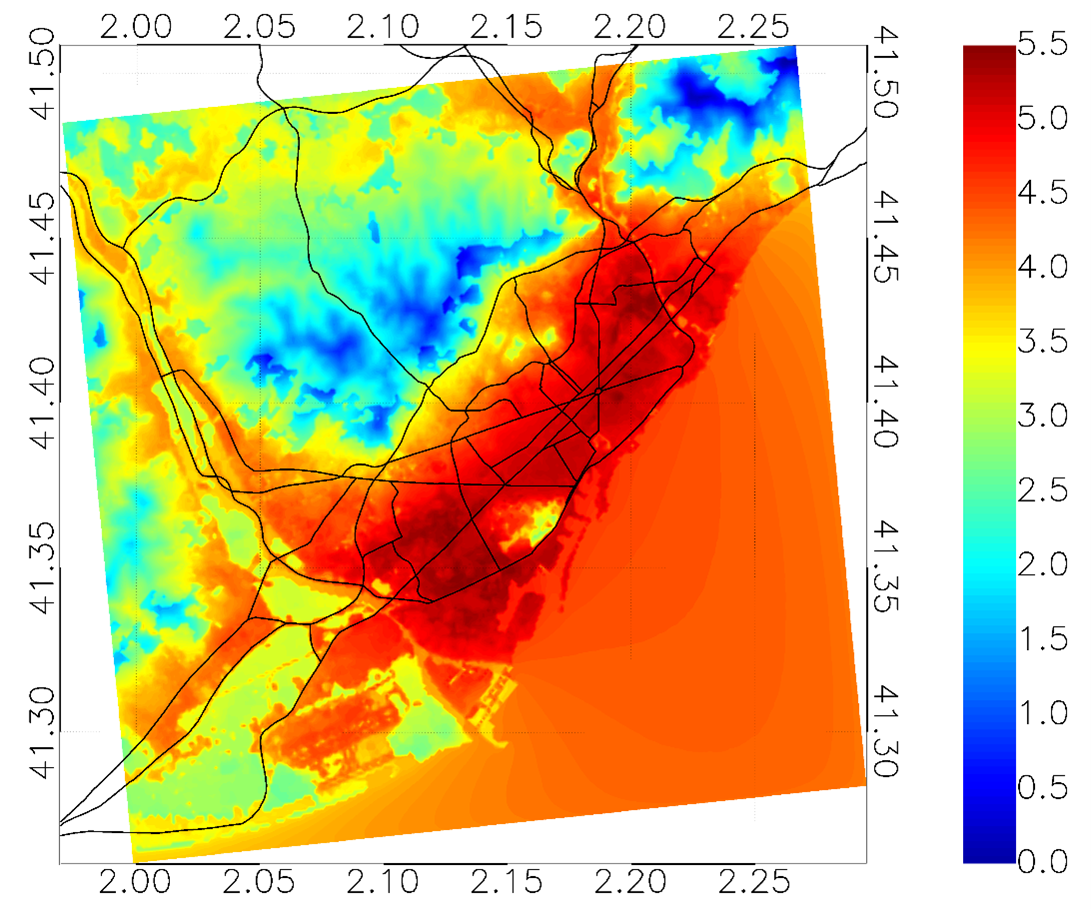
Example output map of the UrbClim model, showing the average Urban Heat Island intensity of the city of Barcelona (Spain) during the summer months. Source: VITO.
Example output map of the UrbClim model, showing the average Urban Heat Island intensity of the city of Barcelona (Spain) during the summer months. Source: VITO.
The UrbClim model has been applied before in a pan-European context, providing detailed urban climate data for a 10-year historical period for 100 cities in Europe, in the framework of the Copernicus Health contract for the C3S data platform. The data have also been used to work out an Urban Heat Island indicator for the European Environmental Agency’s Urban Adaptation Map viewer. These results have been validated with 67 meteorological measurement stations across Europe, yielding excellent error statistics.

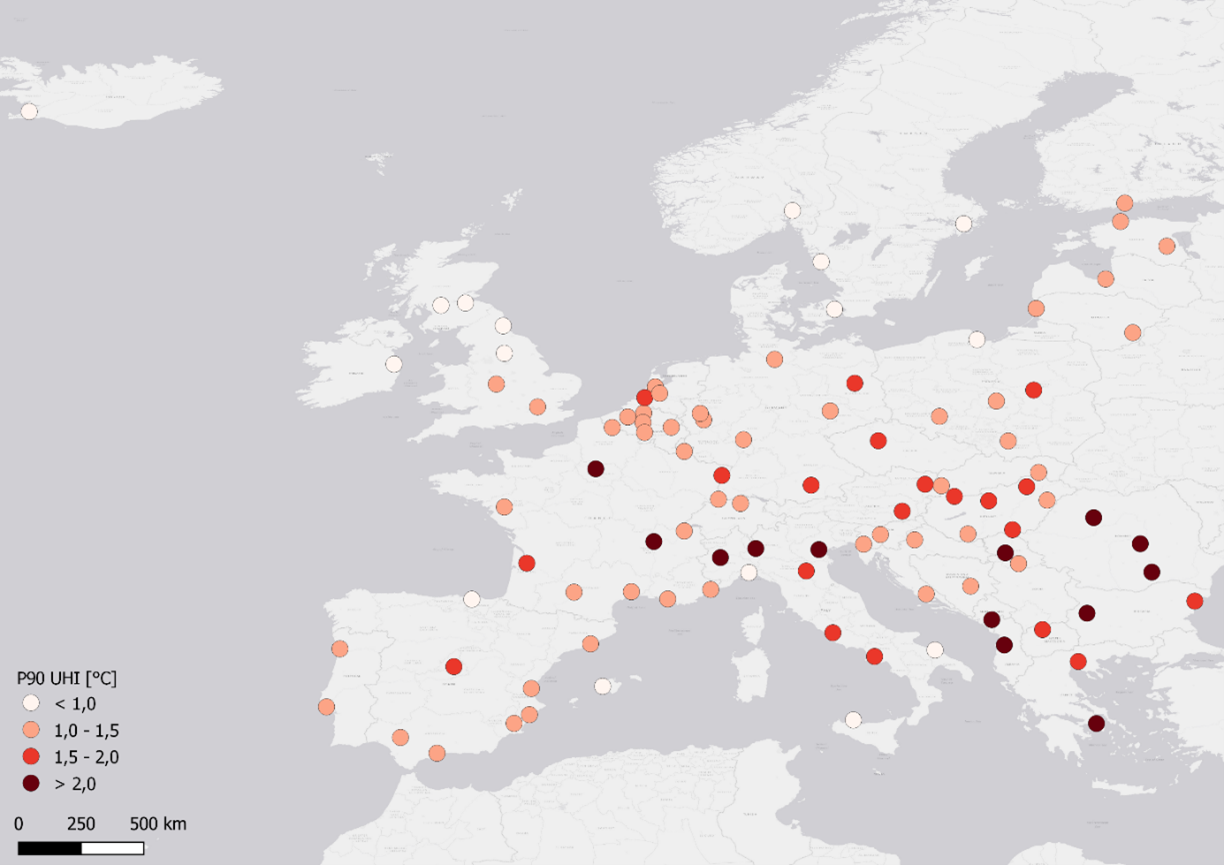
Spatial distribution of the UHI indicator for all 100 modelled cities in Europe. Source: VITO.
Spatial distribution of the UHI indicator for all 100 modelled cities in Europe. Source: VITO.
For the service developed in this project, it will be possible to launch the model from an API request, invoking automatic model calculations on DestinE’s core services platform. In the API, the model domain will be specified as well as the number of historical years to be modelled, future climate projection data to be used and the output indicator to be calculated. The urban data and maps will be made available to the user through an interactive interface, including selection, viewing, analysing and download capabilities.


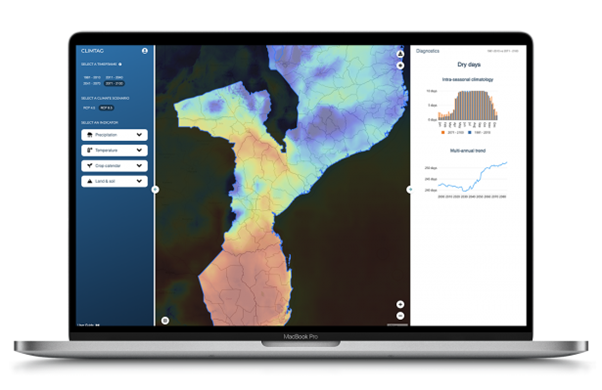
Example user dashboard based on the GEOVIEW software platform. Source: VITO.
Example user dashboard based on the GEOVIEW software platform. Source: VITO.
In the first phase of the project, a broad stakeholder community was gathered around the topic of urban heat stress. Three main users of the service were identified: DG REGIO, the City of Prague and the Lisbon Metropolitan Area. Besides these three main users, a long list of additional stakeholders are involved in the service. Through telco’s and a dedicated hybrid user exchange workshop in Brussels, user needs and requirements were collected, which provided input to shape the outline of the use case.


Urban Heat use case ‘core team’, participating in the User Exchange Workshop: Jörn Hoffman (ECMWF, contract provider); delegation of VITO (Filip Lefebre & Dirk Lauwaet, contractor); Joachim Maes (DG REGIO, core user); Maria Kazmuková (City of Prague, representative of demo city). Excused: João Lopes and Frederico Metelo (Lisbon Metropolitan Area, representatives of demo city).
Urban Heat use case ‘core team’, participating in the User Exchange Workshop: Jörn Hoffman (ECMWF, contract provider); delegation of VITO (Filip Lefebre & Dirk Lauwaet, contractor); Joachim Maes (DG REGIO, core user); Maria Kazmuková (City of Prague, representative of demo city). Excused: João Lopes and Frederico Metelo (Lisbon Metropolitan Area, representatives of demo city).
The Urban Heat service will be compiled in a way that computation of the following output data will be possible:
· Heat stress calculations will be performed for both a recent past period (2011-2020) and future climate projections (2020-2040/2050).
· The climate projections from DT Climate will be compared to IPCC CMIP6 global climate model results.
· Three advanced heat stress variables (the Wet Bulb Globe Temperature (WBGT), the Universal Thermal Climate Index (UTCI) and the Apparent Temperature), that take temperature, humidity, wind speed and radiation into account, will be calculated.
· The calculations will be performed with a horizontal resolution of 100m and will cover the entire metropolitan areas of Prague and Lisbon.
· Both raw hourly output data as well as decadal overview maps will be provided.
· The following output indicators will be provided: Urban Heat Island (UHI) intensity, number of heatwave days, exposure of the population to heatwaves, heat-related mortality, exceedances of health threshold levels, lost working hours and cool island identification.
Furthermore, the potential of the service to assess the impact of climate adaptation measures (e.g. land cover changes, urban trees, soil unsealing,…) will be demonstrated for the two demonstration cities. As this is a manual and context specific process, this aspect will not be included in the automatic operational service.
Important to note is that the service, demonstrated for 2 specific cities, will be implemented in a way that can be easily replicated for any urban area in Europe in a potential follow-up project.


Potential urban heat stress adaptation measures. Source: Google images.
Potential urban heat stress adaptation measures. Source: Google images.
The second phase of the project has been started and the UrbClim model was set up for the two demonstration cities of Prague and Lisbon, performing model simulations for the reference period (2011-2020), based on ERA5 reanalysis data. Postprocessing scripts have been written to calculate the agreed upon urban heat indicators. First output maps were produced and discussed with the demonstration cities.

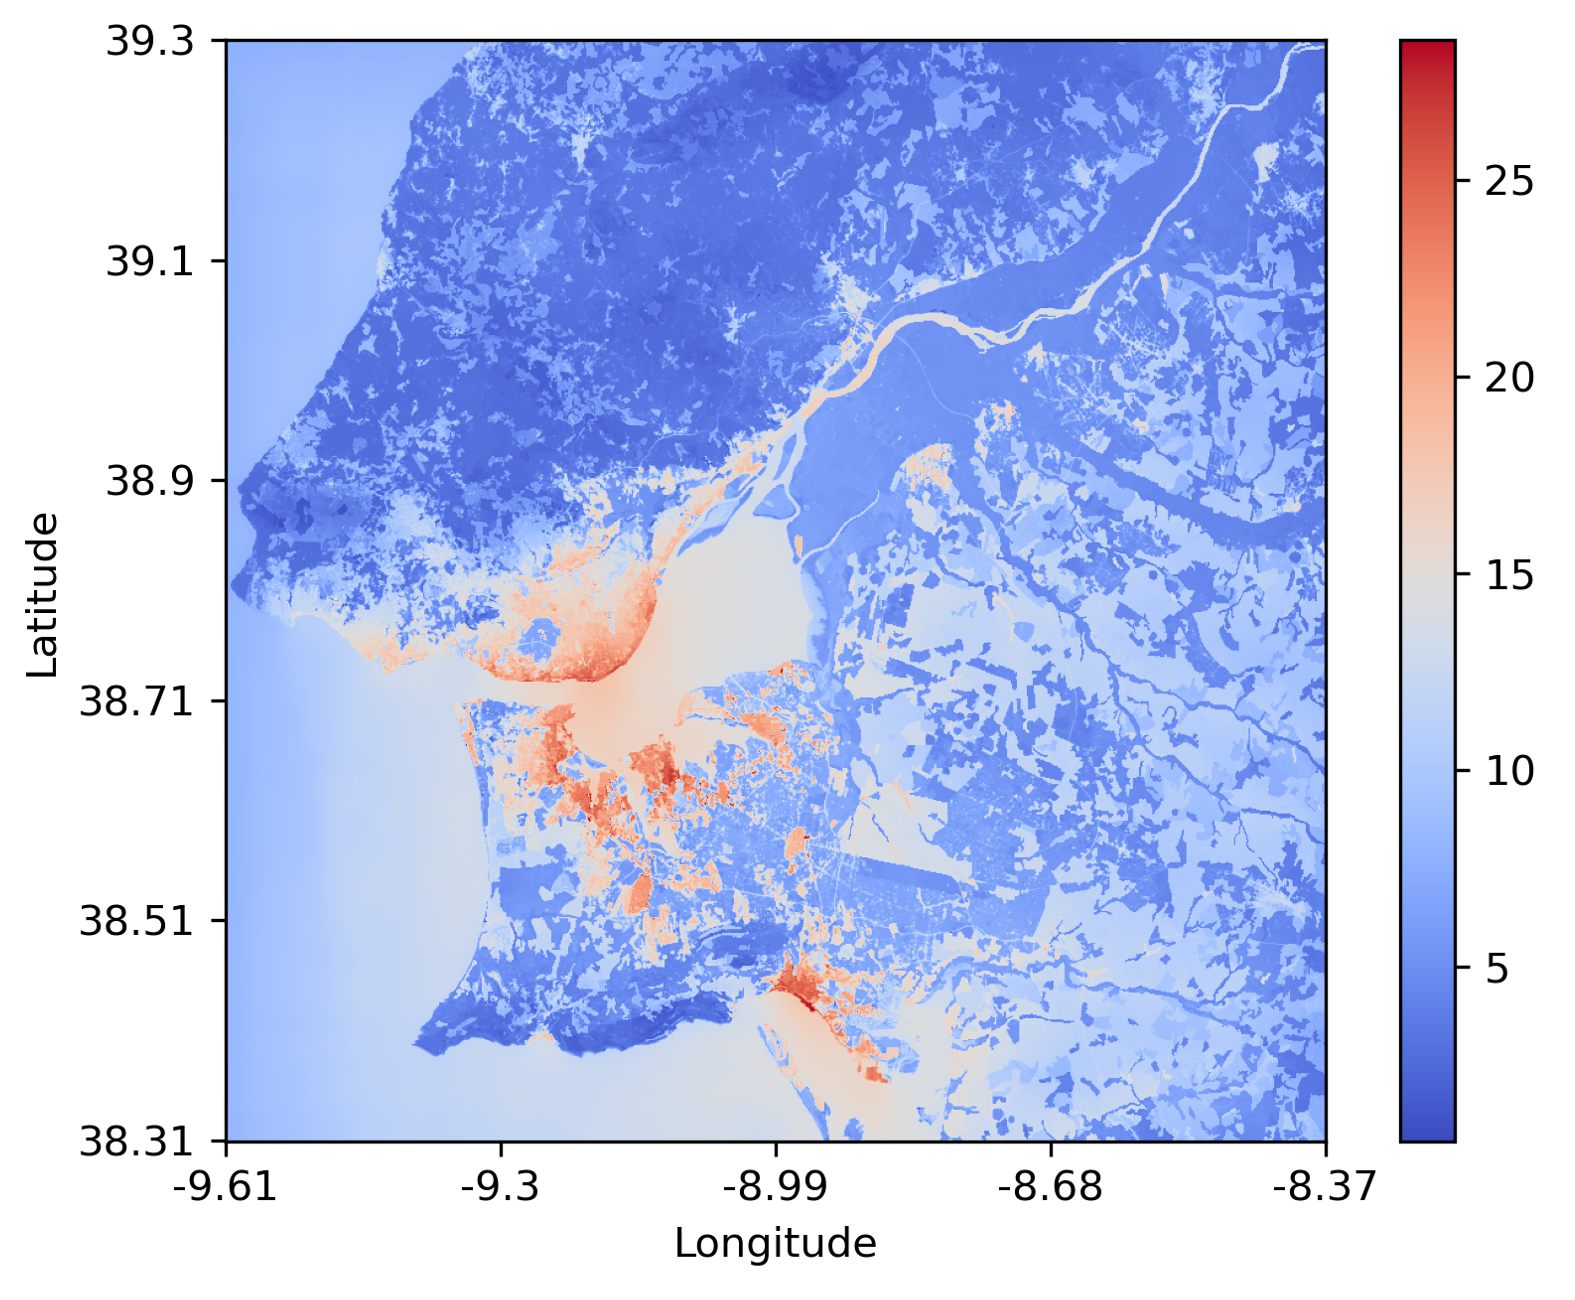
Annual number of tropical nights, defined as nights during which the 2m air temperature was always above 20°C, for the city of Lisbon. Source: VITO.
Annual number of tropical nights, defined as nights during which the 2m air temperature was always above 20°C, for the city of Lisbon. Source: VITO.

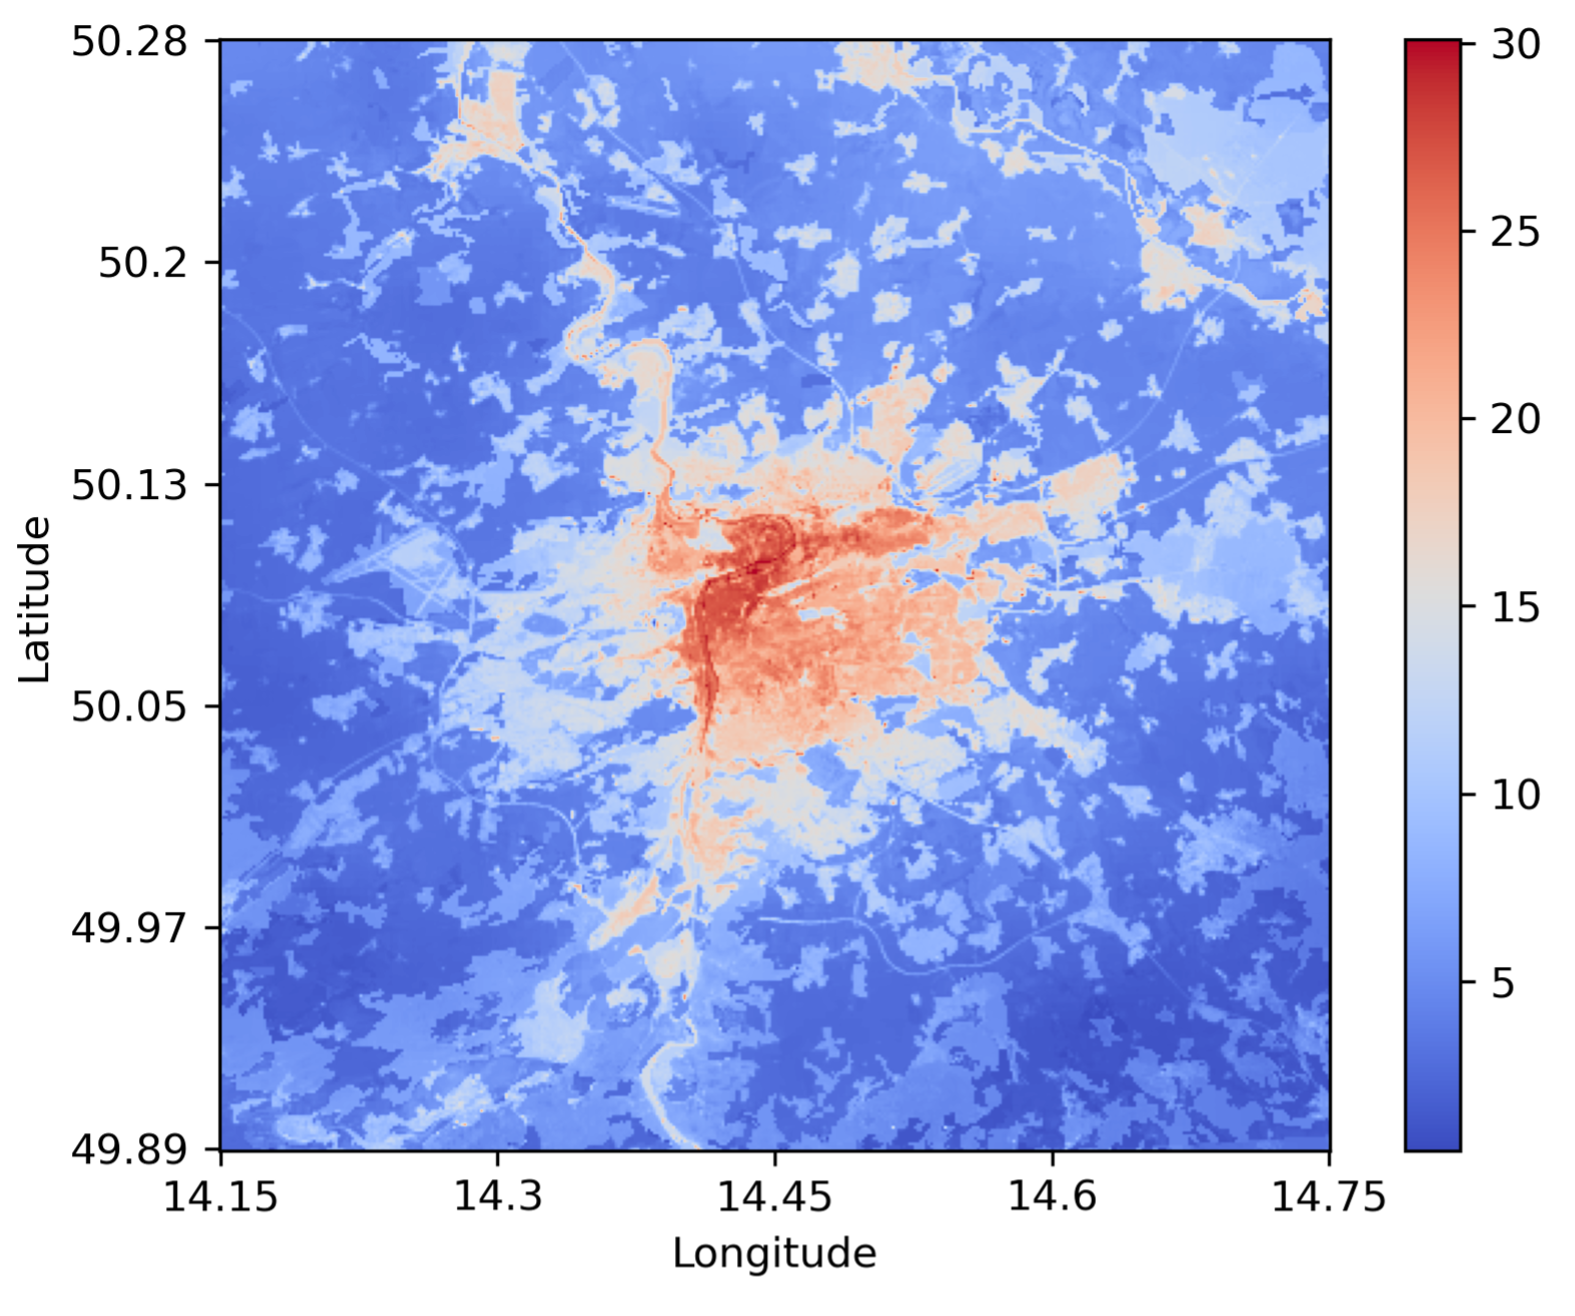
Annual number of tropical nights, defined as nights during which the 2m air temperature was always above 20°C, for the city of Prague. Source: VITO.
Annual number of tropical nights, defined as nights during which the 2m air temperature was always above 20°C, for the city of Prague. Source: VITO.
Furthermore, a validation exercise was performed, using existing networks of local measurement stations that were available in both demonstration cities. The UrbClim results were compared to daily mean temperatures and daily maximum apparent temperatures from measurements for the summer of 2022. The model was capable of reproducing observed values with small biases and good error statistics, certainly giving the fact that most of these stations were in non-optimal measurement locations and used non-professional equipment (e.g. no automatic ventilation). So the model results are found to correctly represent the local air temperature and humidity conditions in both demonstration cities.

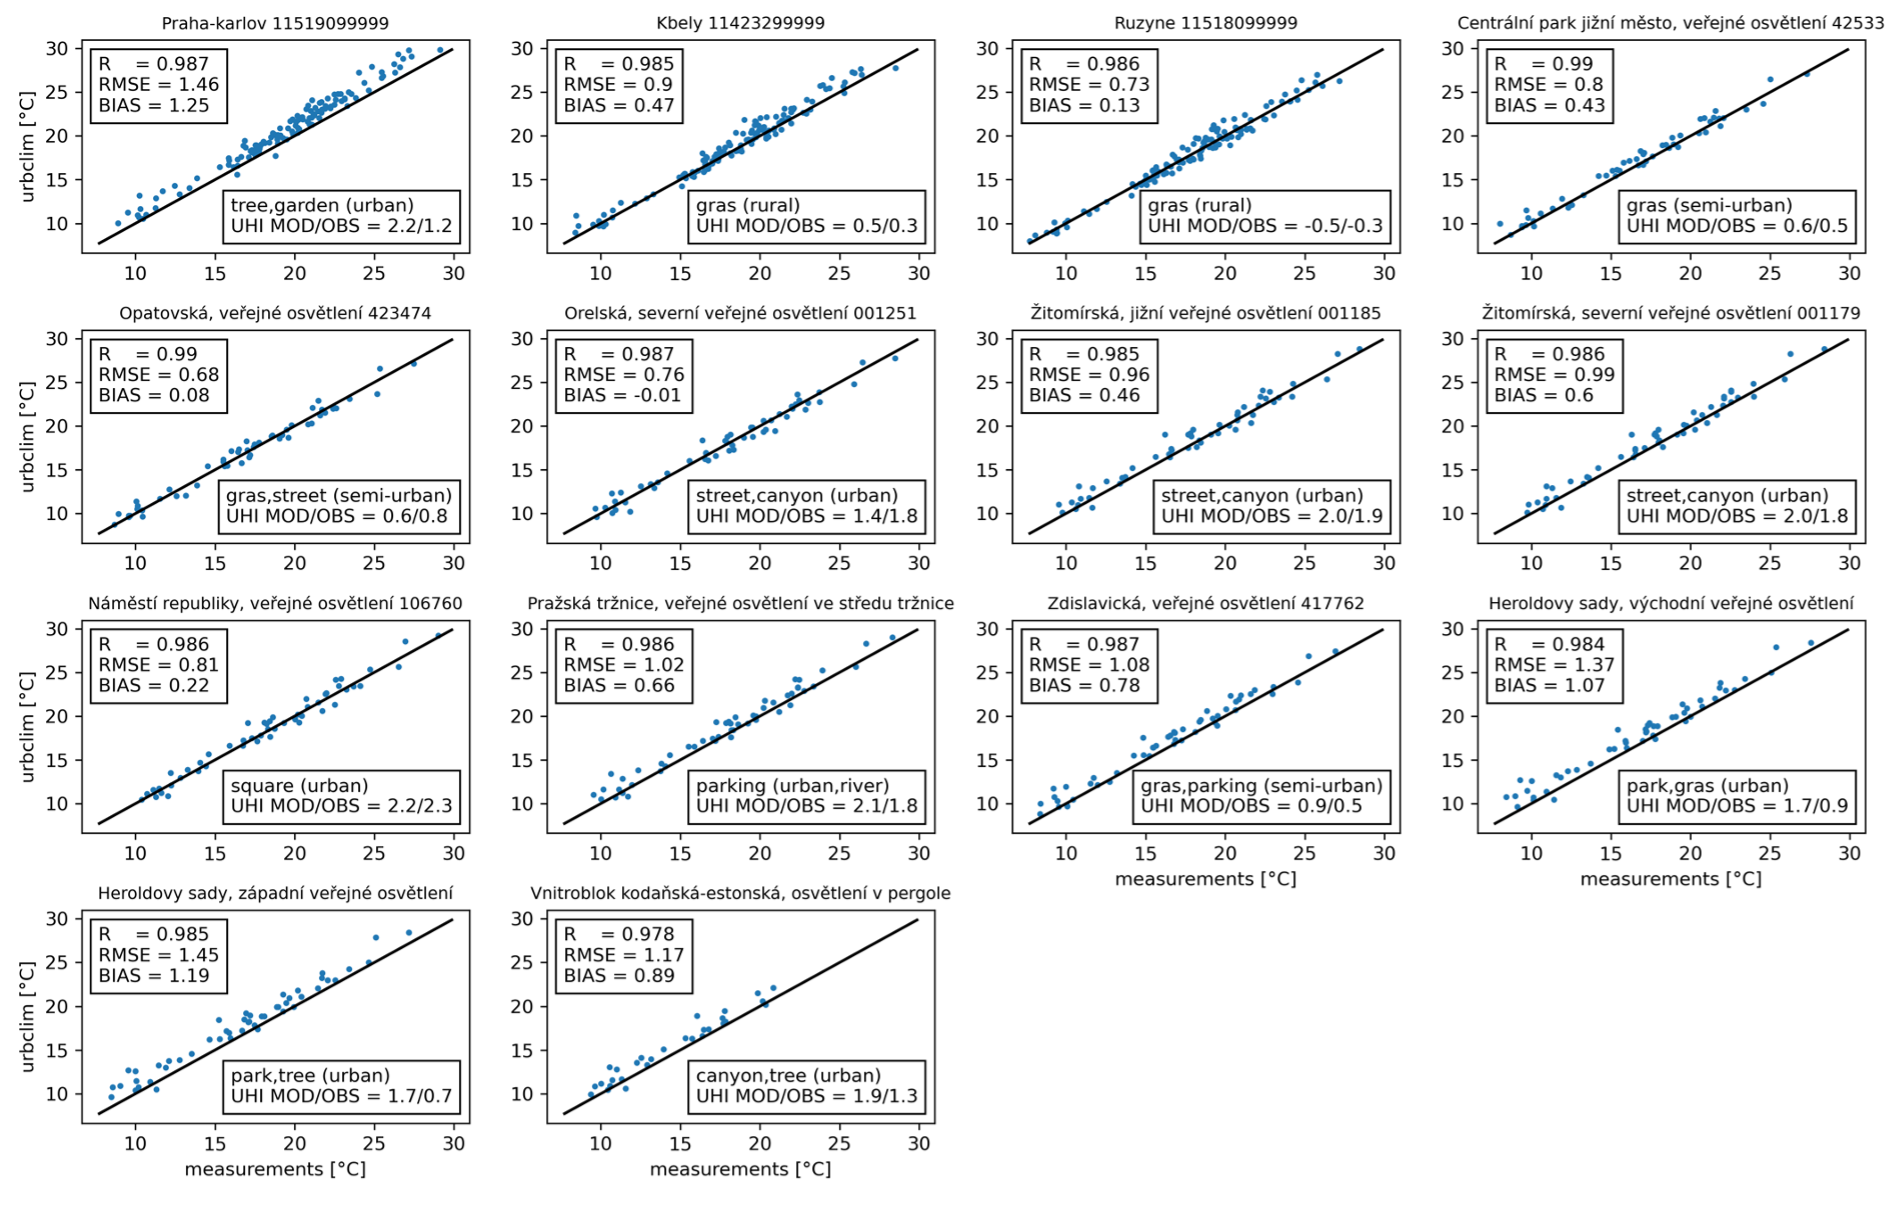
Comparison of observed and modelled daily mean air temperatures for the summer of 2022 for 14 local measurement stations in Prague. In the panel for each station the correlation (R), Root Mean Square Error (RMSE) and mean bias are shown, as well as the Urban Heat Island (UHI) value, for which the average values of Kbely and Ruzyne are used as the rural reference. Source: VITO.
Comparison of observed and modelled daily mean air temperatures for the summer of 2022 for 14 local measurement stations in Prague. In the panel for each station the correlation (R), Root Mean Square Error (RMSE) and mean bias are shown, as well as the Urban Heat Island (UHI) value, for which the average values of Kbely and Ruzyne are used as the rural reference. Source: VITO.

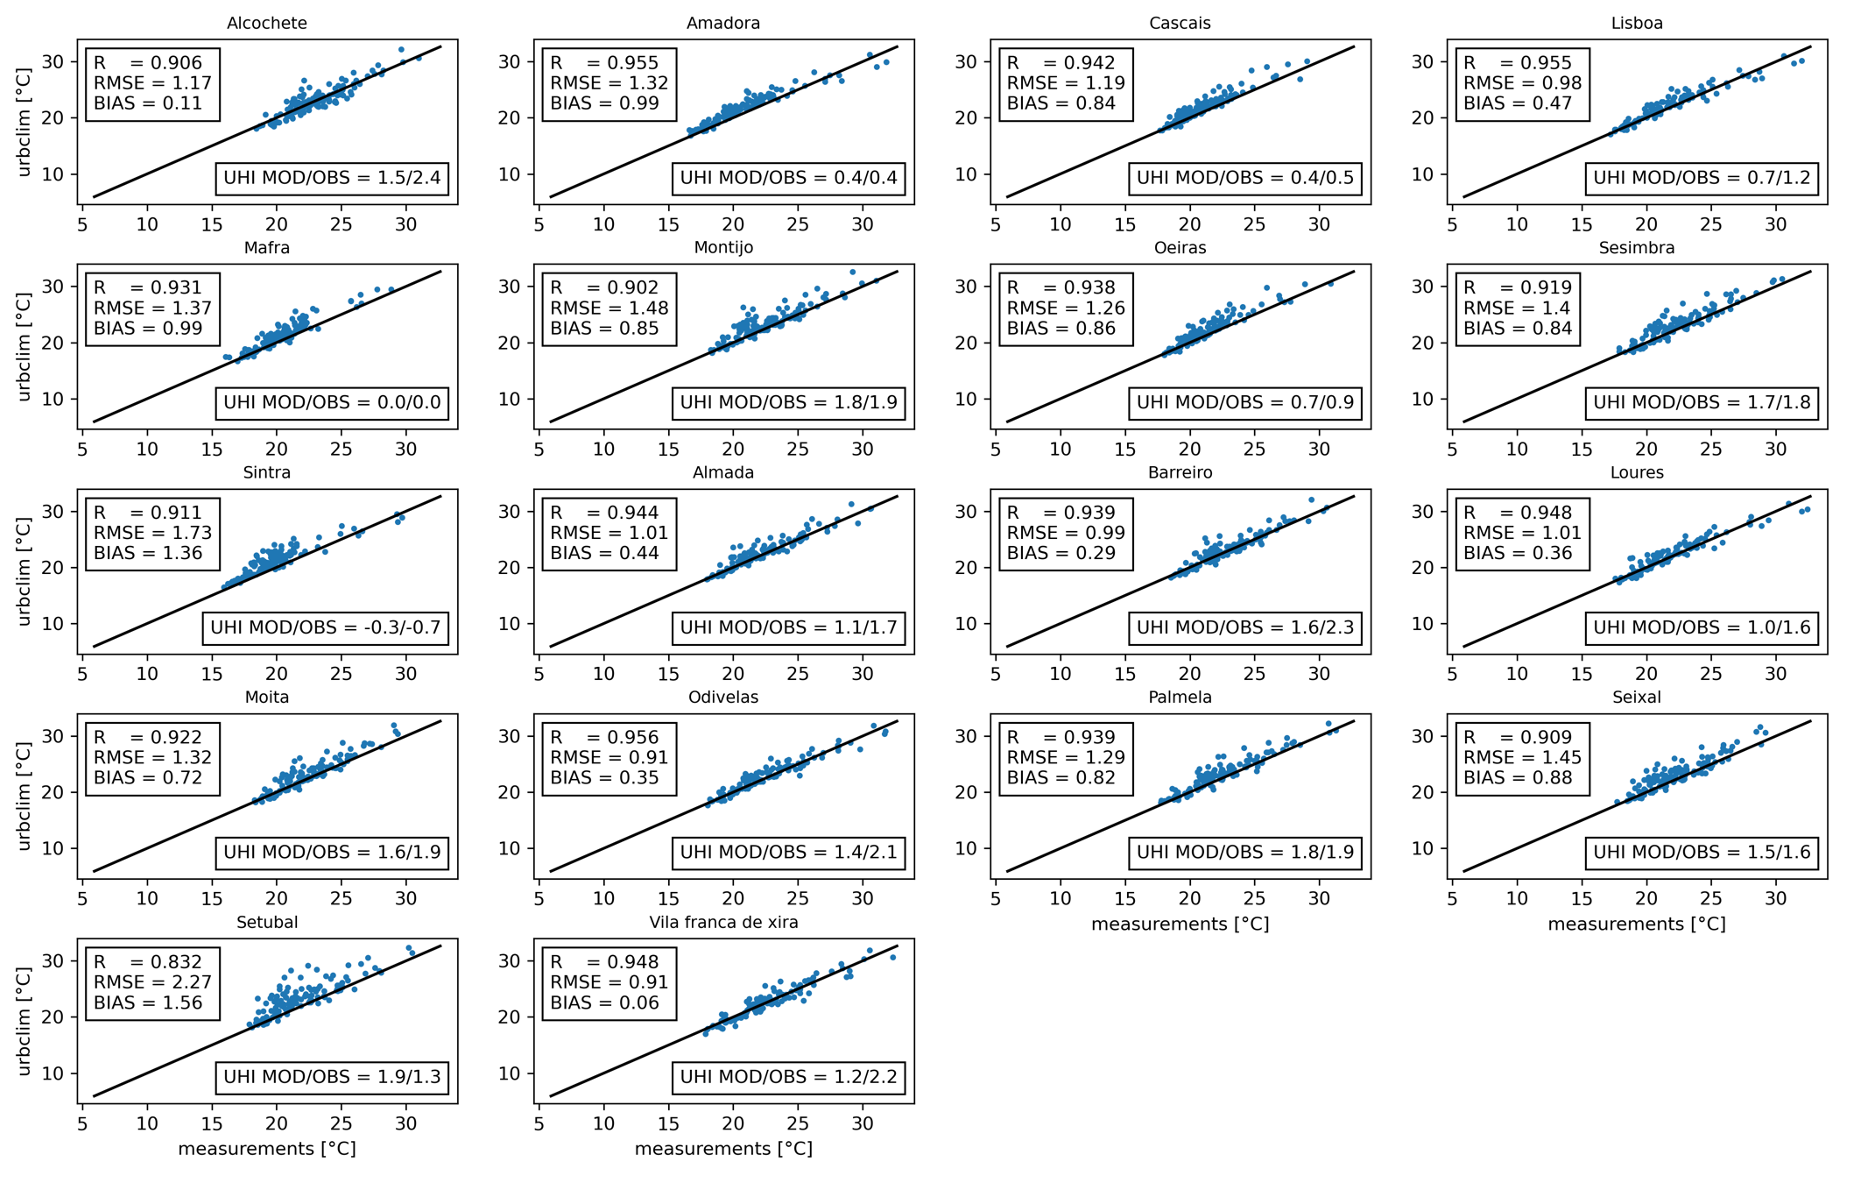
Comparison of observed and modelled daily mean air temperatures for the summer of 2022 for 18 local measurement stations in Lisbon. In the panel for each station the correlation (R), Root Mean Square Error (RMSE) and mean bias are shown, as well as the Urban Heat Island (UHI) value, for which the average values of M afra are used as the rural reference. Source: VITO.
Comparison of observed and modelled daily mean air temperatures for the summer of 2022 for 18 local measurement stations in Lisbon. In the panel for each station the correlation (R), Root Mean Square Error (RMSE) and mean bias are shown, as well as the Urban Heat Island (UHI) value, for which the average values of M afra are used as the rural reference. Source: VITO.
The users and contractor will jointly demonstrate the concrete use of the urban data, maps and user interface. This might be done by overlaying urban heat indicator maps with suitable spatially explicit socio-economic information to derive sectoral heat impact maps. As part of this joint exercise, a performance assessment will be made, considering both the scientific uncertainty of the data and their fitness-for-purpose.
More information:
- Read the first news article about this use case here
- Find more about Destination Earth Invitations to Tender here
- Return to Destination Earth webpage