Urban heat islands and heat mortality
Demonstrating heat stress
in European cities

Heat stress in European cities
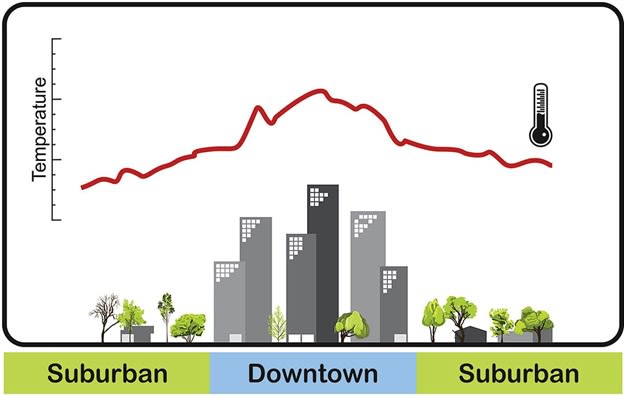
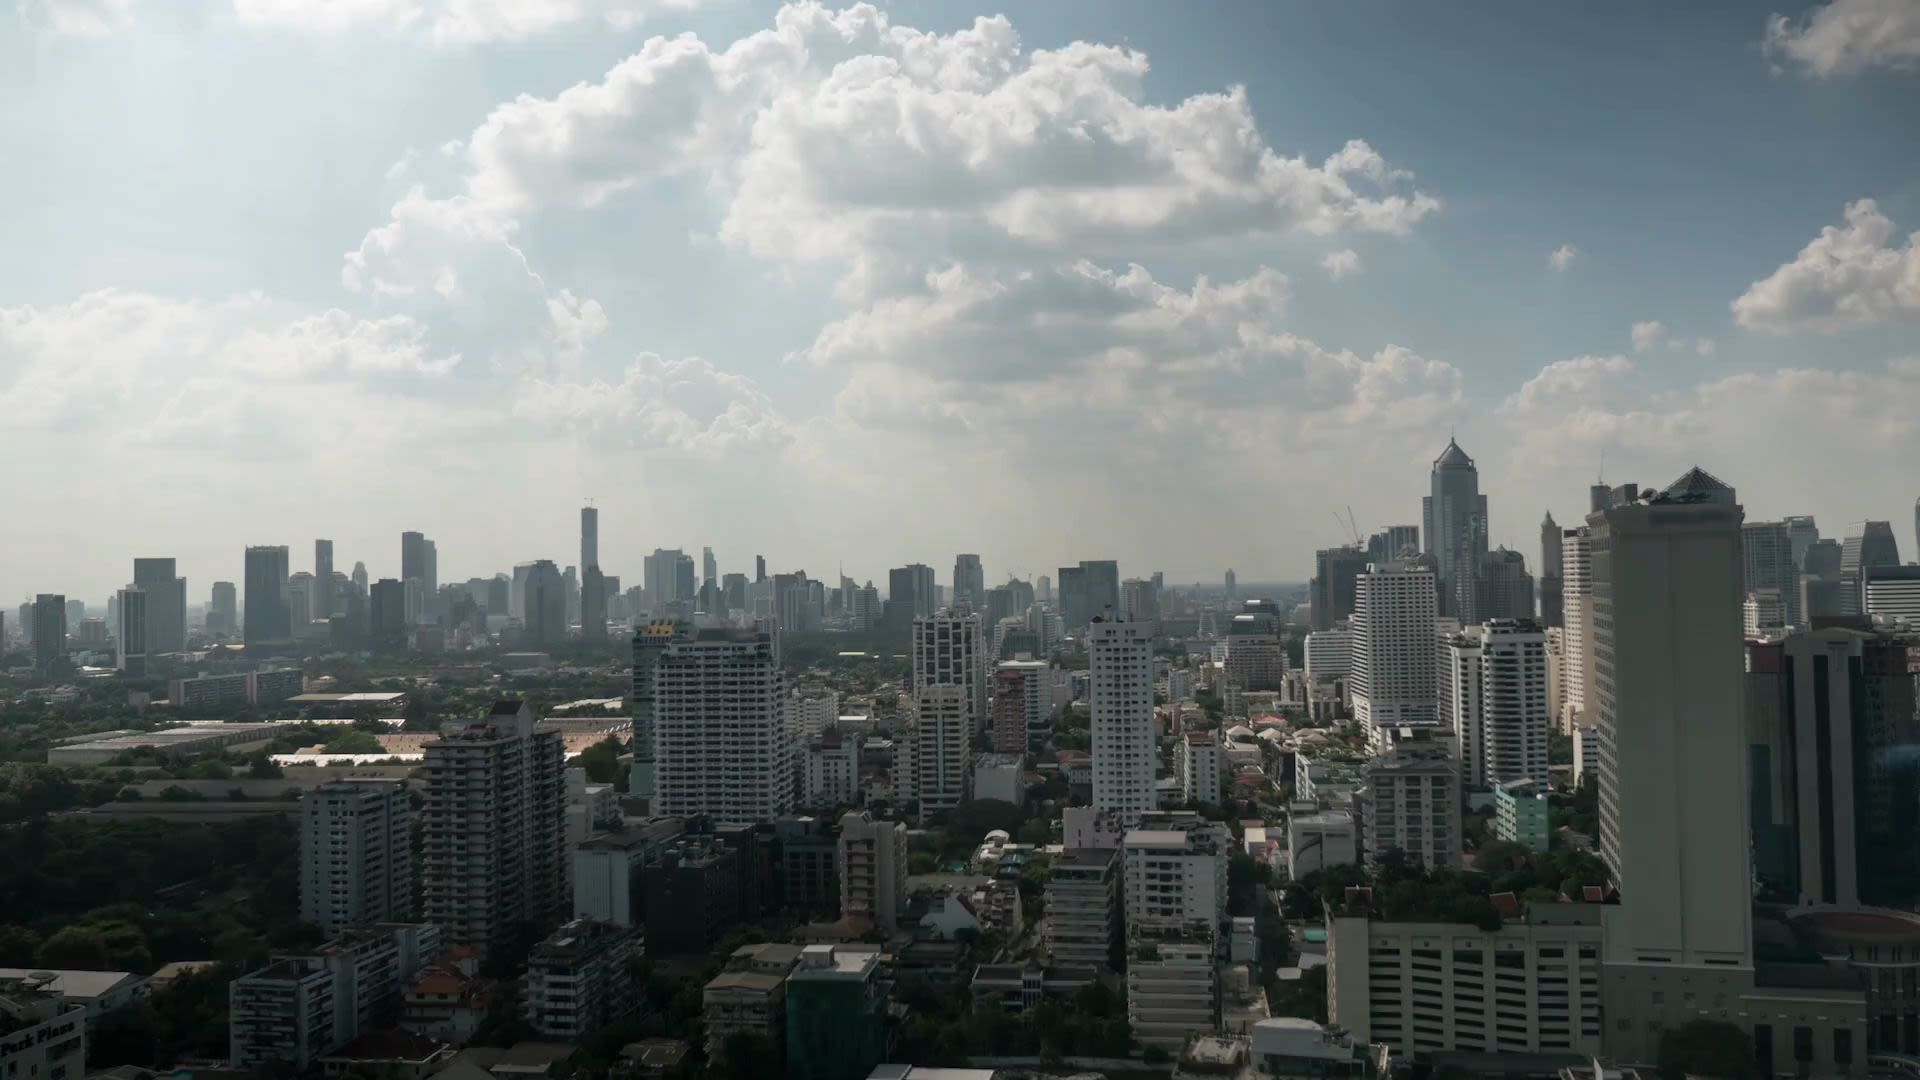
Around three quarters of the European population lives in urban areas, a proportion that is expected to grow in the coming decades. Urban environments are especially impacted by extreme temperatures, such as those experienced in Europe during summer 2020. Temperatures rise because paved ground absorbs heat, buildings and narrow streets trap heat, and human activities add heat to the surroundings.
This ‘urban heat island’ effect means that urban populations are more at risk than rural ones from the harmful effects of rising temperatures. Extreme heat can bring a range of health problems, and heat-related mortality is increasing; the impacts are especially dangerous to vulnerable ageing European populations.
The Flemish Institute of Technological Research (VITO) and partners used Copernicus Climate Change Service (C3S) data combined with an urban model to design a set of datasets and applications to analyse heat stress in European cities and their consequences on our public health.


A case study of Paço do Lumiar, Brazil showing determination of land surface temperature and urban heat islands from geostationary data for different land use and covers. Credit: J. Silva et al Science Direct 2018.
A case study of Paço do Lumiar, Brazil showing determination of land surface temperature and urban heat islands from geostationary data for different land use and covers. Credit: J. Silva et al Science Direct 2018.
How heat impacts
human health
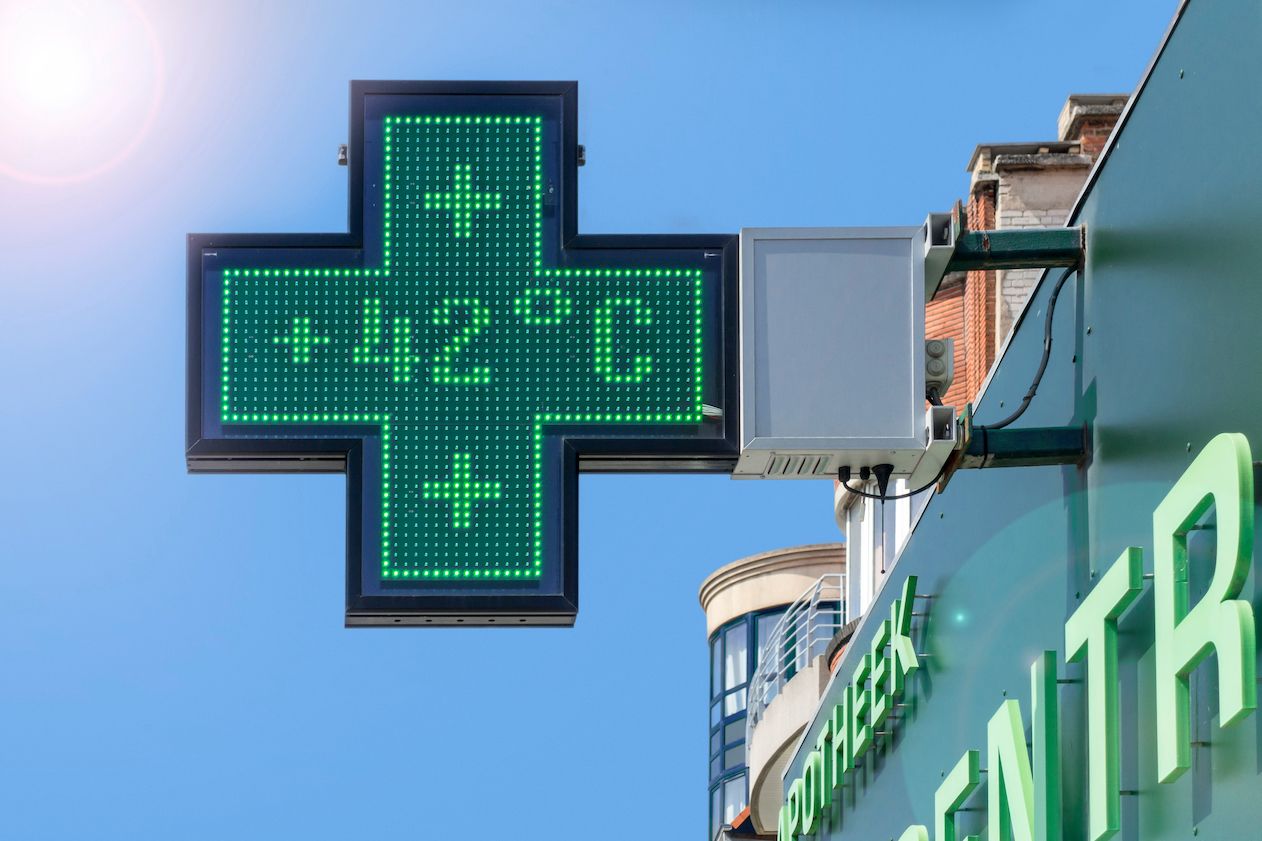
Extreme temperatures can have adverse effects on human health, potentially leading to immediate problems such as heat stroke and heat exhaustion, and giving rise to cardiovascular and respiratory disorders in the longer term.

“Temperatures will go up, we will be more exposed to a higher number, more frequent and more intense heatwaves and thus the impact on the health of the populations living throughout the world will be greater.”
Vulnerable people, for example children and the elderly, are especially at risk, and in many cases extreme heat can lead to premature death; around 70 000 Europeans died due to a major heatwave that struck the continent in 2003.
A recent study analysing data from 43 countries found that between 1991 and 2018, 37% of heat-related deaths could be attributed to human-driven climate change.
Climate change
worsens heat stress
Lowering heat stress in urban environments is crucial to protect the lives of vulnerable people, ensure urban climate resilience for the future and improve quality of life for European citizens.

Research has shown that strategies to lower urban heat can reduce heat-related deaths. A recent study in Italy measured the impacts of the country’s national heat plan, finding that heat-preventative measures reduced heat-related deaths by 30%.
Under future climate change scenarios, scientists predict that extreme heatwaves will become more frequent and severe. Land and sea temperatures in Europe are already increasing, and precipitation patterns – which can help reduce heat pressures – are becoming more variable. Much of southern Europe, for example, is likely to become drier, in which case the impact of heat will increase.
Climate change is altering the entire Earth system, amplifying the effects of extreme weather events such as heatwaves.
Freak events like the high-pressure heatwave experienced by Greece in 2021 – bringing temperatures over 47°C – are expected to become more common around the world.
Temperatures will increase over time, and heatwaves are predicted to occur more often, last longer, and become more severe. In most regions of the world, heatwaves and other extreme weather events such as flooding have already become more frequent. Air and water quality could also get worse, particularly in urban areas.

Cities are all different.
Their vulnerability to climate change depends on a wide range of factors, including their location on the planet and the physical characteristics of structures, urban spaces and vegetation.
By understanding how exactly heat patterns will evolve over the next century, urban planners can redesign cities to adapt to the impacts of climate change.
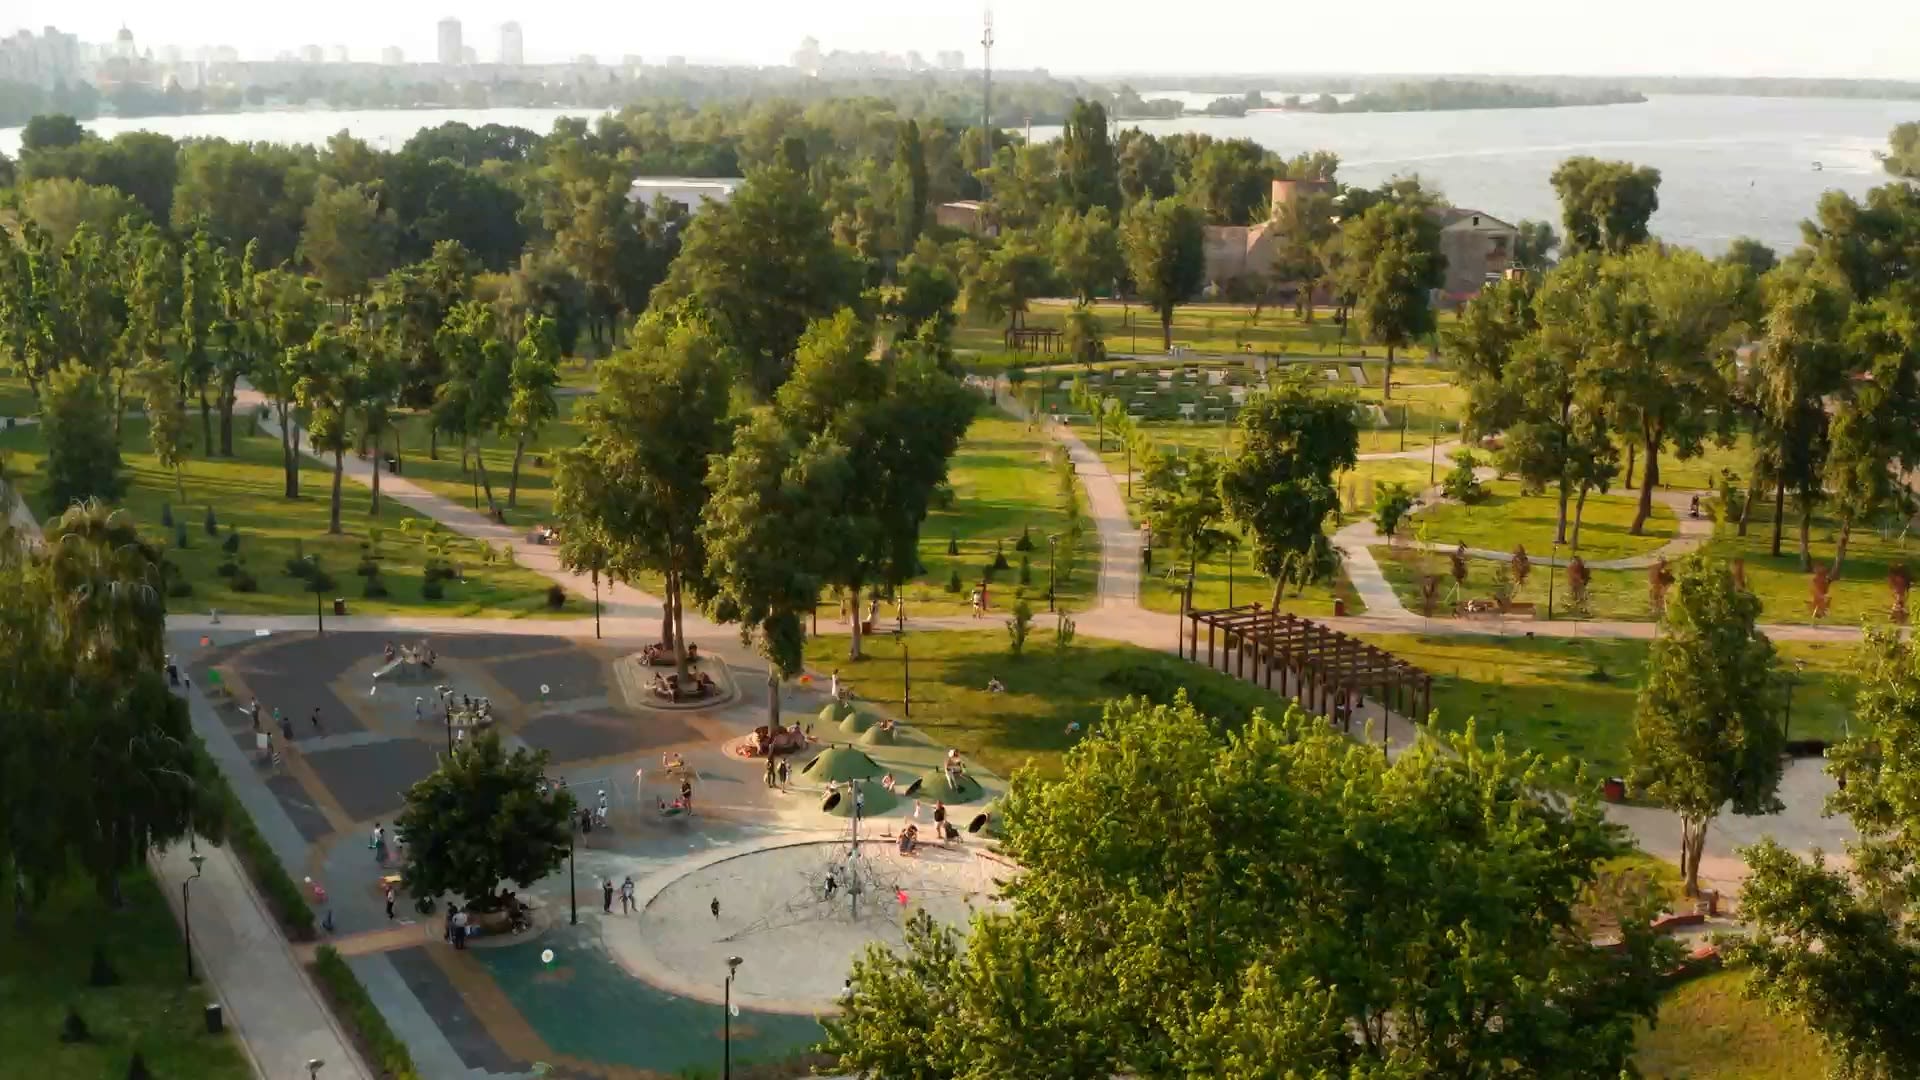
Strategies to combat and reduce urban heat stress include developing so-called green-blue infrastructure, which includes enhanced vegetation cover,
for example through green roofs,
and more water surface.

These policies will make cities greener, more resilient, and more sustainable, while lowering urban greenhouse gas emissions, relieving pressure on a local and global scale. Air quality, noise pollution and biodiversity can all be improved through green urban policies, making cities more comfortable to live in.
Research institutes such as VITO bring the high-quality C3S climate data to its full advantage by designing applications about heat patterns showing easily comparable charts, maps and climate visualisations. These applications make C3S data more reachable to stakeholders less used to working with climate data. They are useful to Urban planners needing to adapt designs to the impact of climate change, regional governments and also transnational organisations such as the European Commission.


City scale climate data are crucial to support urban policies in enhancing the green-blue infrastructure. Spatial heat patterns at the city-scale were obtained with an urban climate model called UrbClim®, which can conduct simulations over long time periods at a resolution of down to 100 metres. Such a high resolution enables users to see the difference in heat between urban and rural areas in great detail, down to the scale of a neighbourhood. It also highlights the urban heat island effect, which can be used when modelling the effects of targeted policies to reduce it.
The UrbClim® model was fed with both atmosphere data from C3S' ERA5 reanalysis available through the Climate Data Store (CDS), and urban terrain data including land use data, soil and vegetation data and anthropogenic heat flux. The model is simplified by not calculating internal pressure gradients and by using a constant land use map. However, validation exercises have shown the model capable of correctly capturing the overall magnitude of the urban heat island effect, even for cities with strong local thermal circulations, and considering land use in most European cities has not changed much over the simulation period.
Background image: This is a schematic of the UrbClim model developed at VITO which has a capability of simulating long time periods at a high spatial resolution (~100 m). Credit: VITO.
C3S data for healthy urban environments
“Mainly there are research people and policymakers in both the urban planning sector and the health sector that benefit from this.”
A dataset was created including air temperature, humidity and wind speed for the 100 selected cities.
This application explores the data contained in the dataset Climate variables for cities in Europe from 2008 to 2017, presenting them as easily comparable charts and maps. It is available in the CDS.
Users can select the city they wish to explore, then choose from a range of variables, including temperature, wind and humidity. They can quickly drill down into the data to find, for example, urban areas that suffer from higher levels of heat stress. Users can also cycle through the years to see how the urban heat island effect evolved between 2008 and 2017.
A second application, also publicly available in the CDS, offers detailed climate visualisations on Urban Heat Island Intensity of the period 2008–2017 for each of the 100 cities across Europe.
Urban heat island information is generated for summer and winter, and during both day and night. This is crucial as urban heat island effects are particularly pronounced during the night. Urban planners can use this information to design new strategies such as introducing green roofs and green spaces at critical locations within a city.
The team that developed the tools have already found that larger cities experience higher levels of heat stress.
In Antwerp, for example, the urban heat island effect is 2°C during the night and the centres of London and Paris regularly record night temperatures that are around 4°C higher than their rural surroundings.
These findings confirm existing theories that the urban heat island effect is stronger during the night. During the day, artificial structures such as buildings, pavements and roads absorb heat, and then at night they release it. Specific strategies to target this problem – either at the absorption or release phases – could significantly reduce the urban heat island effect.
Tool for assessing urban heat and
heat-related mortality
VITO examined the expected impacts of climate change on heat-attributable deaths, under low and high carbon emission scenarios.
An application has been developed by VITO in collaboration with C3S to offer information about the expected intensity of heatwaves across the continent in the near (2031–2060) and far (2071–2100) future. This application can be used by urban planners and regional governments to assess the impacts of heatwaves.
The team found that heat-related deaths in Europe are likely to increase, in both RCP4.5 and RCP8.5 emission scenarios.
Certain Mediterranean cities, which are especially prone to the effects of harmful heatwaves, are particularly vulnerable to heat-related deaths. These include Barcelona and Valencia in Spain, and Milan and Rome in Italy.


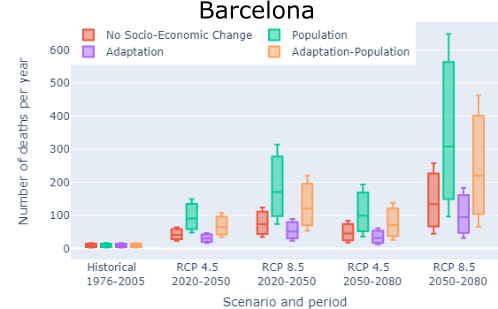
Projected number of deaths per year in Barcelona under different emission scenarios and different socio-economic scenarios.
Projected number of deaths per year in Barcelona under different emission scenarios and different socio-economic scenarios.
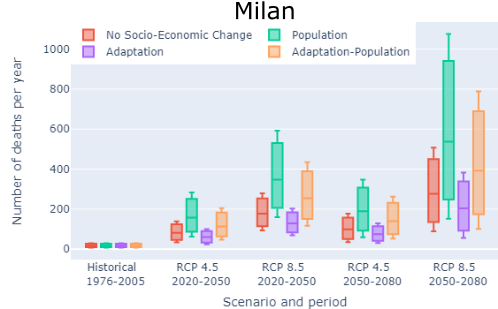
Projected number of deaths per year in Milan under different emission scenarios and different socio-economic scenarios.
Projected number of deaths per year in Milan under different emission scenarios and different socio-economic scenarios.
The average number of heat-related deaths in these cities is predicted to grow by 8 to 10 times in the near future, even under a low-emission scenario (RCP4.5).
Under a high-emission, ‘business-as-usual’ (RCP 8.5) scenario, these deaths could rise by 20 to 30 times the current rate over the next few decades.
The Lazio Regional Health Service also used C3S data…
“We used these data in Italy in order to identify in the major cities which areas are most at risk […] and provide this data to GPs, local health authorities who actually implement the measures during heatwaves.”
Reducing the urban heat island effect
The tools developed in the case study contribute to the UN Sustainable Development Goals (SDGs) by making cities more resilient to climate change, increasing environmental quality and improving the health of European citizens.


SDG 13: Climate action
The decade 2010–2019 was the warmest on record. As carbon continues to flow into the atmosphere, the UN is calling for urgent action to reduce the harmful effects of climate change. This includes the integration of climate change measures into national policy frameworks and climate mitigation efforts.
By accessing detailed information on how heat is affecting Europe’s cities, policymakers and urban planners can begin to address the huge challenges of heatwaves and heat-related mortality.
By working to reduce the urban heat island effect, and the emission of heat through human activities, the effects and causes of climate change can both be reduced.
In this way, the application and related datasets provide a direct contribution to SDG 13, climate action.
SDG 3: Good health and well-being
Significant steps have been taken around the world to improve the health and increase the life expectancy of millions of people. Yet with more intense and frequent heatwaves predicted over the next century, ageing populations such as those in many European cities are increasingly vulnerable to heat-related diseases and death.
Improved green spaces, and blue-green infrastructure will not only reduce heat within cities but can also improve air quality, boosting the health of all European citizens. The tools provide a way for urban planners to assess where the urban heat island effect is strongest and work to counter it. This contributes to SDG 3, good health and well-being.
Stepping towards a cooler,
more resilient future for
Europe’s cities.
The innovative tools and datasets developed through the case study will be a great support to urban planners and policymakers facing the oncoming heat-related challenges of climate change. The datasets can help the necessary transformation of Europe’s cities into sustainable, climate-resilient urban areas fit for the future. Not only will the tools be used to directly combat the urban heat-island effect, but by redesigning cities to overcome this effect, the strategies employed may generate a whole range of indirect health benefits for people living in European cities.