
Tracking air pollution
Using CAMS data to create new downstream applications
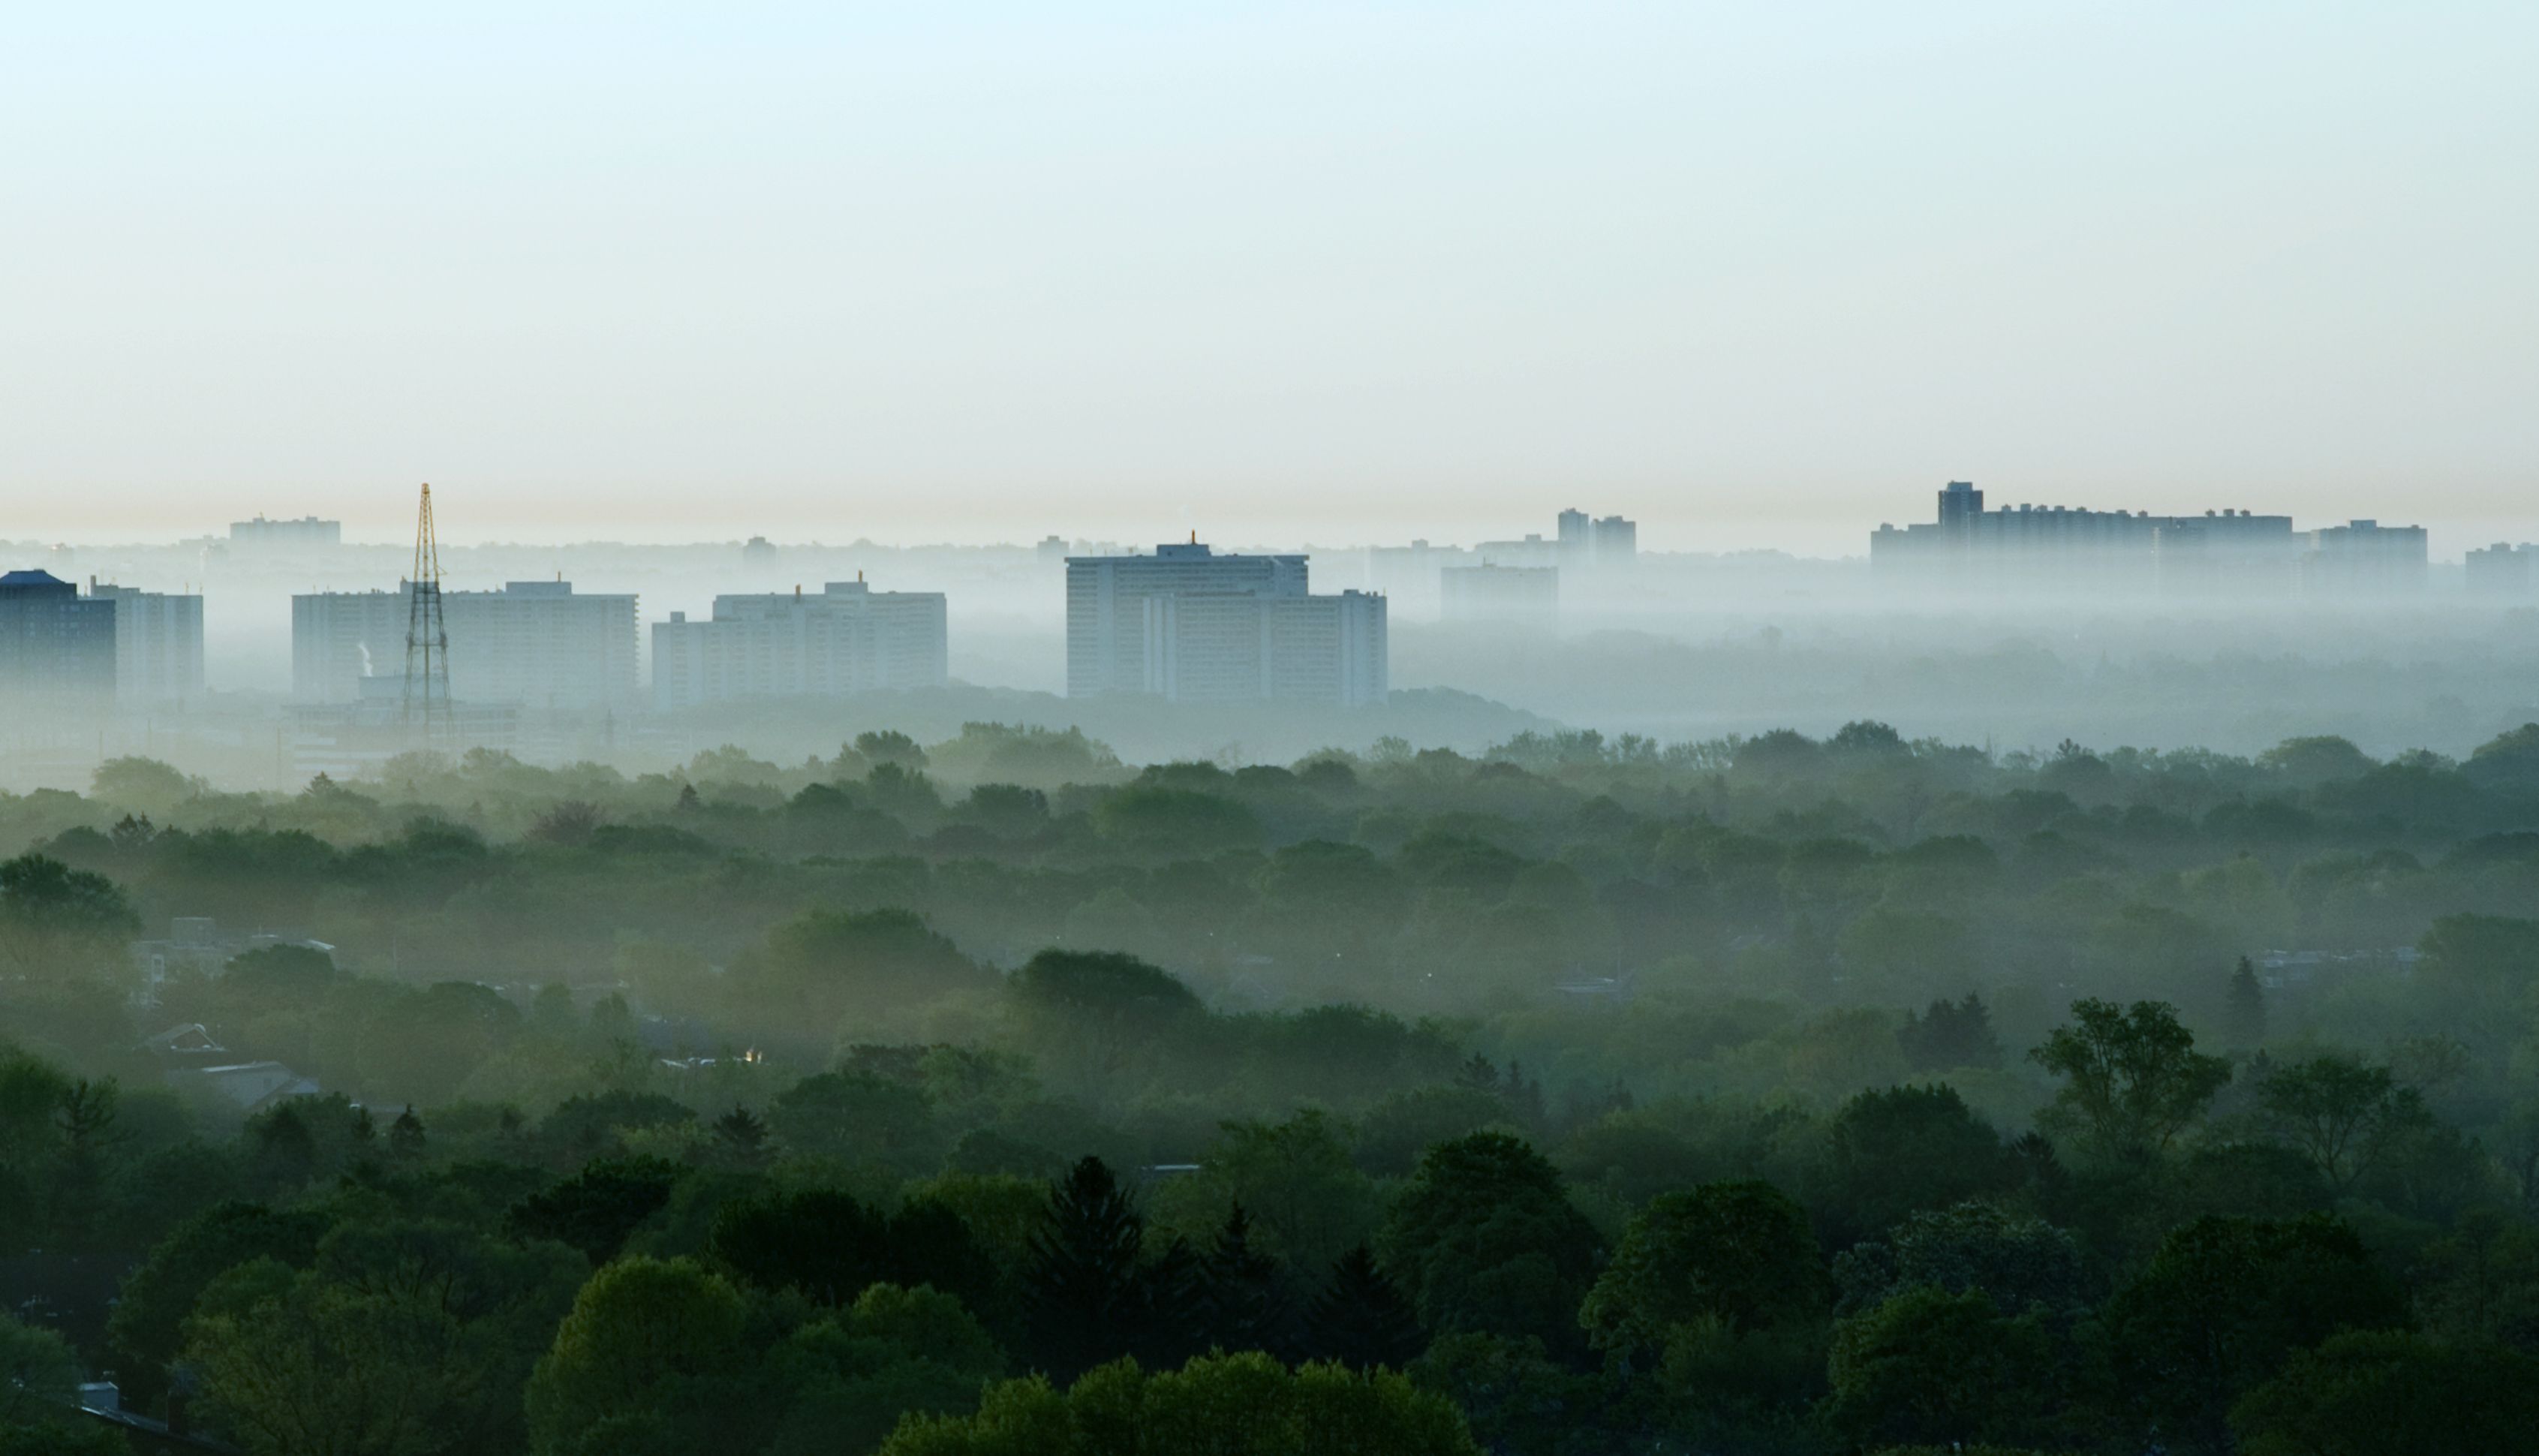

In addition to gases the atmosphere contains suspended microscopic particles of solids and liquids. Dust, organic matter, black carbon, sea salt and sulphate are all examples of these so-called particulate matter, an invisible threat to human health. These particles’ microscopic size is directly linked to their potential for causing health problems since particles with diameters less than 10 micrometres can pass through the throat and nose to enter the lungs.
Local weather conditions move these particles on a regional scale, but larger airflows higher in the atmosphere can transport them across and between continents.
It is therefore important to understand how and where particulate matter is moving, so that industry professionals, authorities and citizens can plan and mitigate the impacts.

The Copernicus Atmosphere Monitoring Service (CAMS) monitors and forecasts air pollution, and their quality-controlled and free data have been used to create new applications to help a range of users across Europe and the rest of the world.

Ivo Lukačovič, founder of Windy:
“We are delighted to be partnering with the Copernicus Atmosphere Monitoring Service to deliver high quality information on air pollution to our users all over the world. Now, more than ever before, we need to be providing data on air quality that all kinds of organisations can use which can ultimately help save lives.”
How air pollution can damage human health
Air is essential for life. Humans breathe in around 14kg of it each day, so the cleaner it is, the healthier we are.

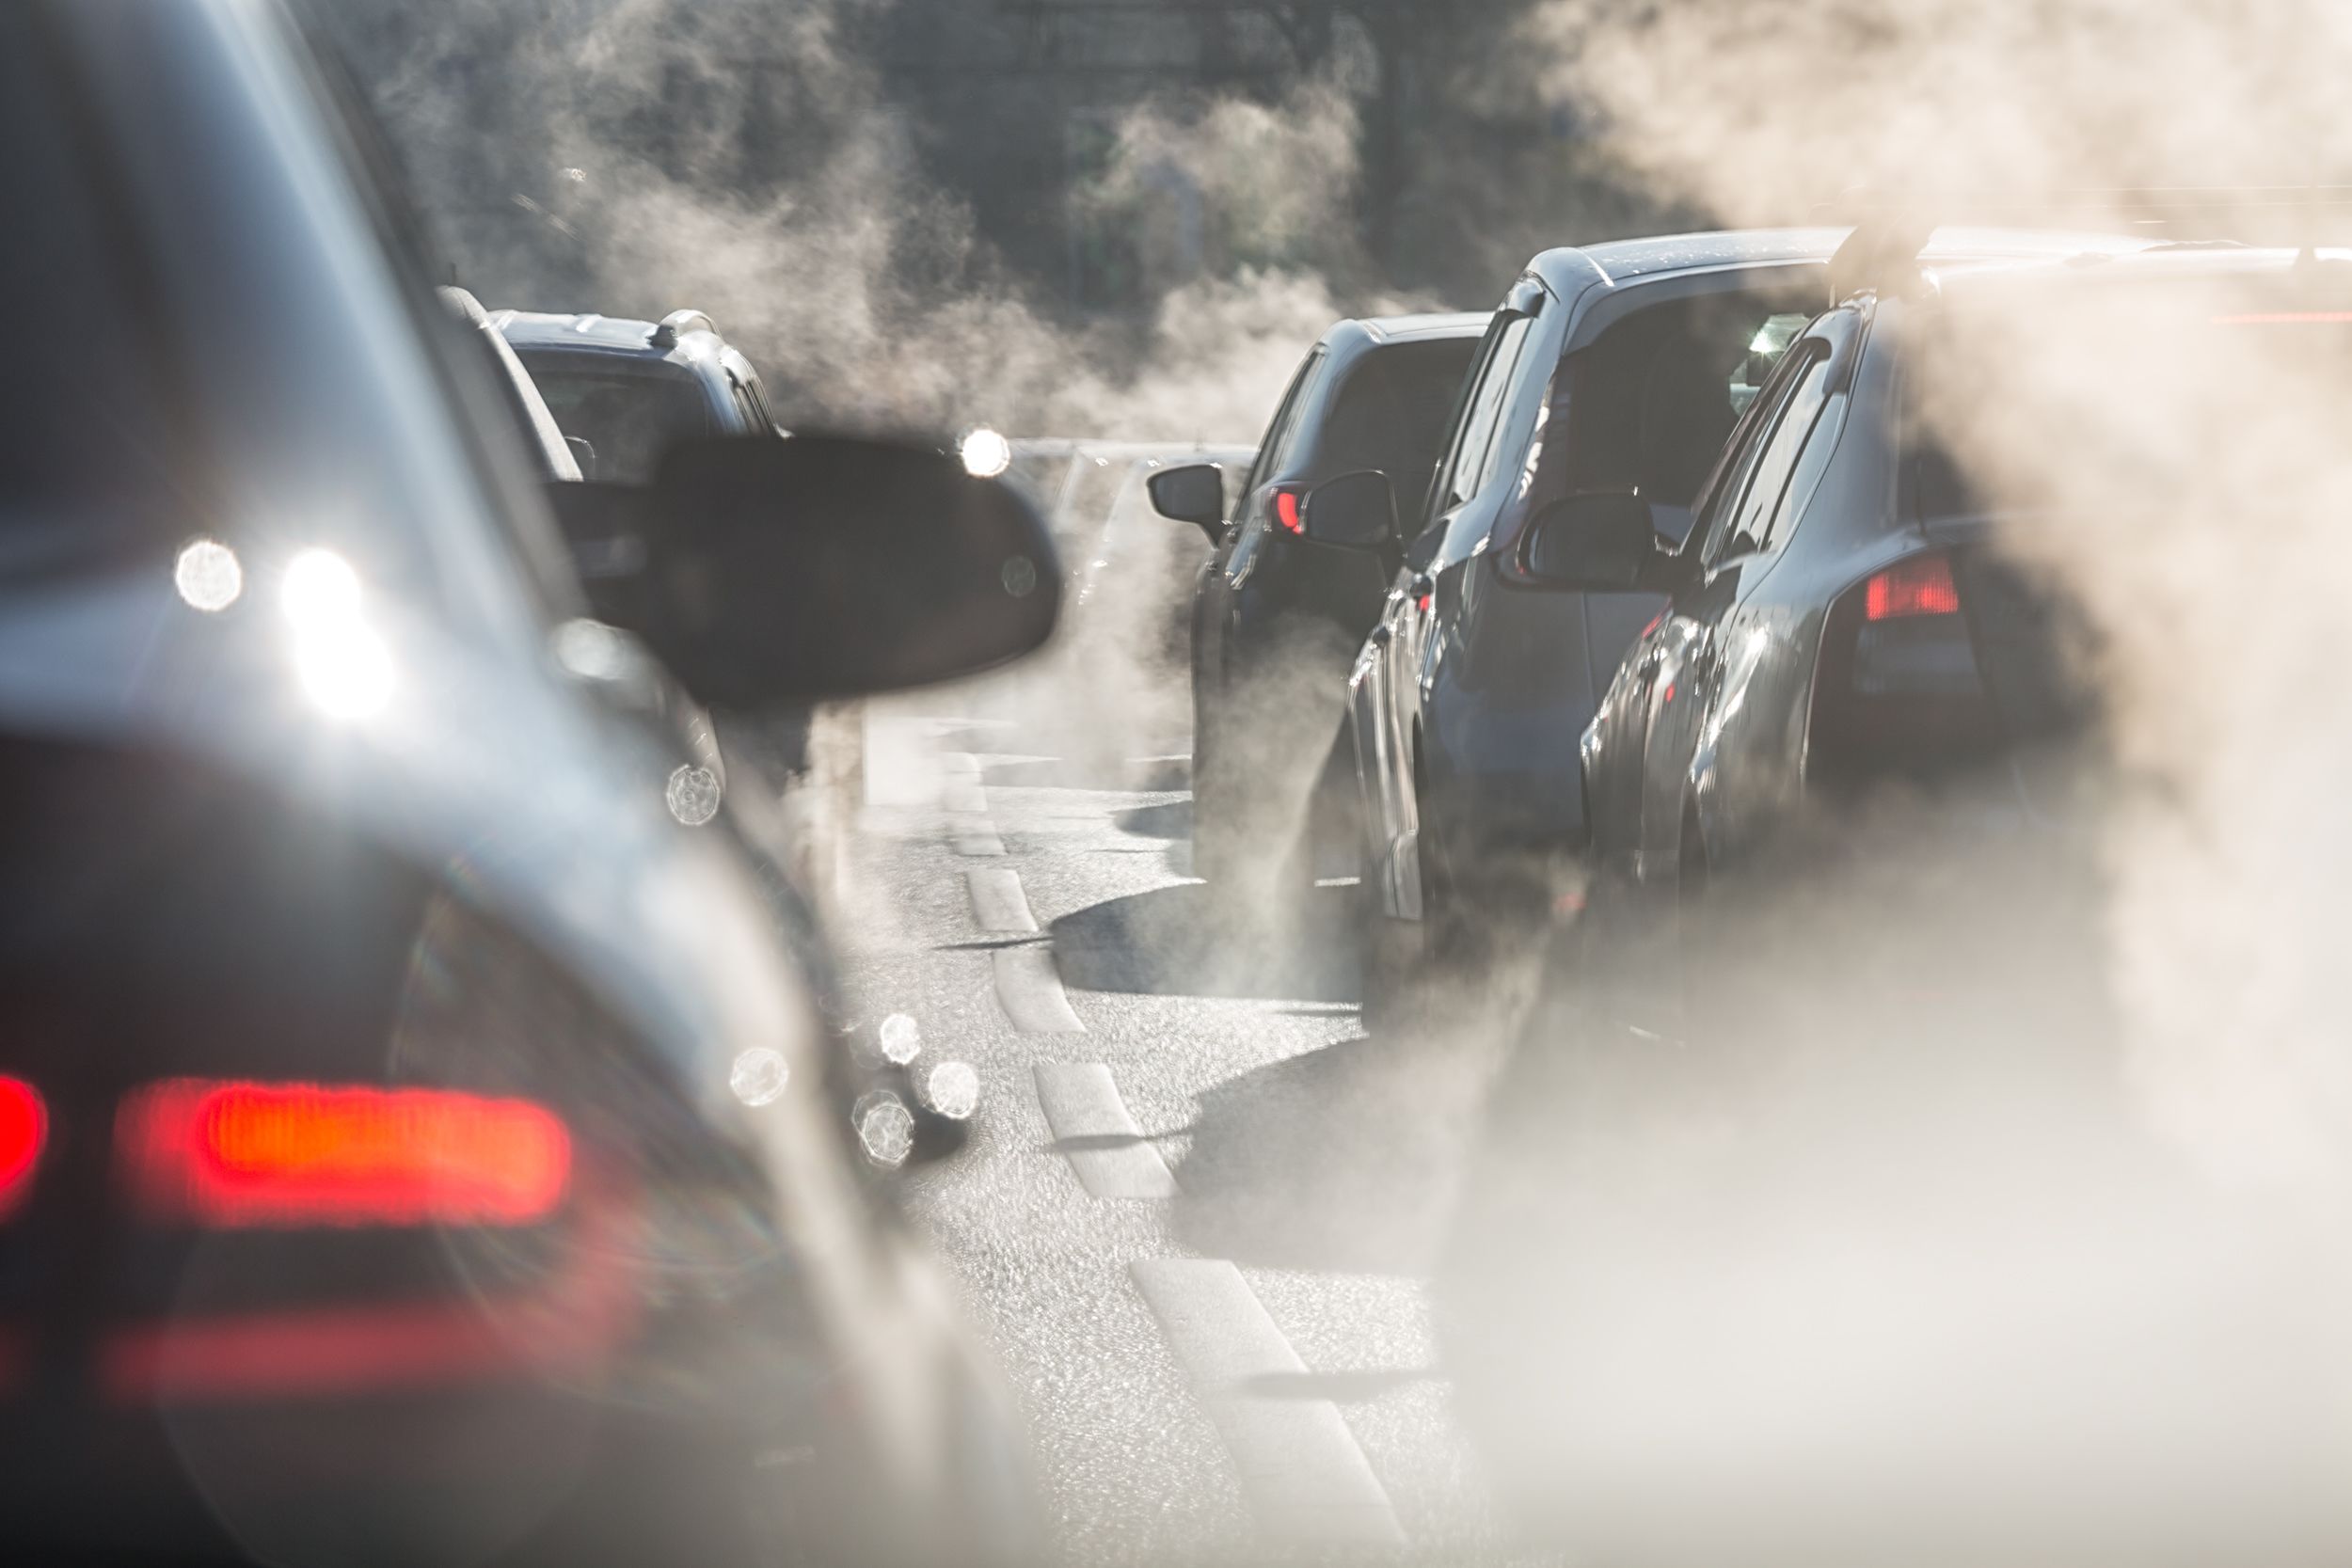
Tiny particles of liquid or solid matter suspended in the air are breathed in along with the gases we need to survive. Particulate matter is created by a variety of natural and human processes, including volcanoes, agriculture, wildfires, vehicle exhausts and industrial processes.
Particulate matter affects more people than any other pollutant and comes in the form of sulphate, nitrates, ammonia, sodium chloride, black carbon, mineral dust and water. It is classified into different sizes, but only PM10 (particles of 10 micrometres or less - coarse) and PM2.5 (particles of 2.5 micrometres or less - fine) are routinely monitored.
PM10 or less can penetrate the lungs, while PM2.5 or less can enter the bloodstream through the air-blood barrier in the lungs, making it a significant health concern.
Poor air quality, including high levels of particulate matter, can lead to a range of respiratory complications, and lower life expectancy in heavily polluted regions. Estimates from The World Health Organization suggest over 90% of the world’s population now breathes air containing harmful levels of pollutants.

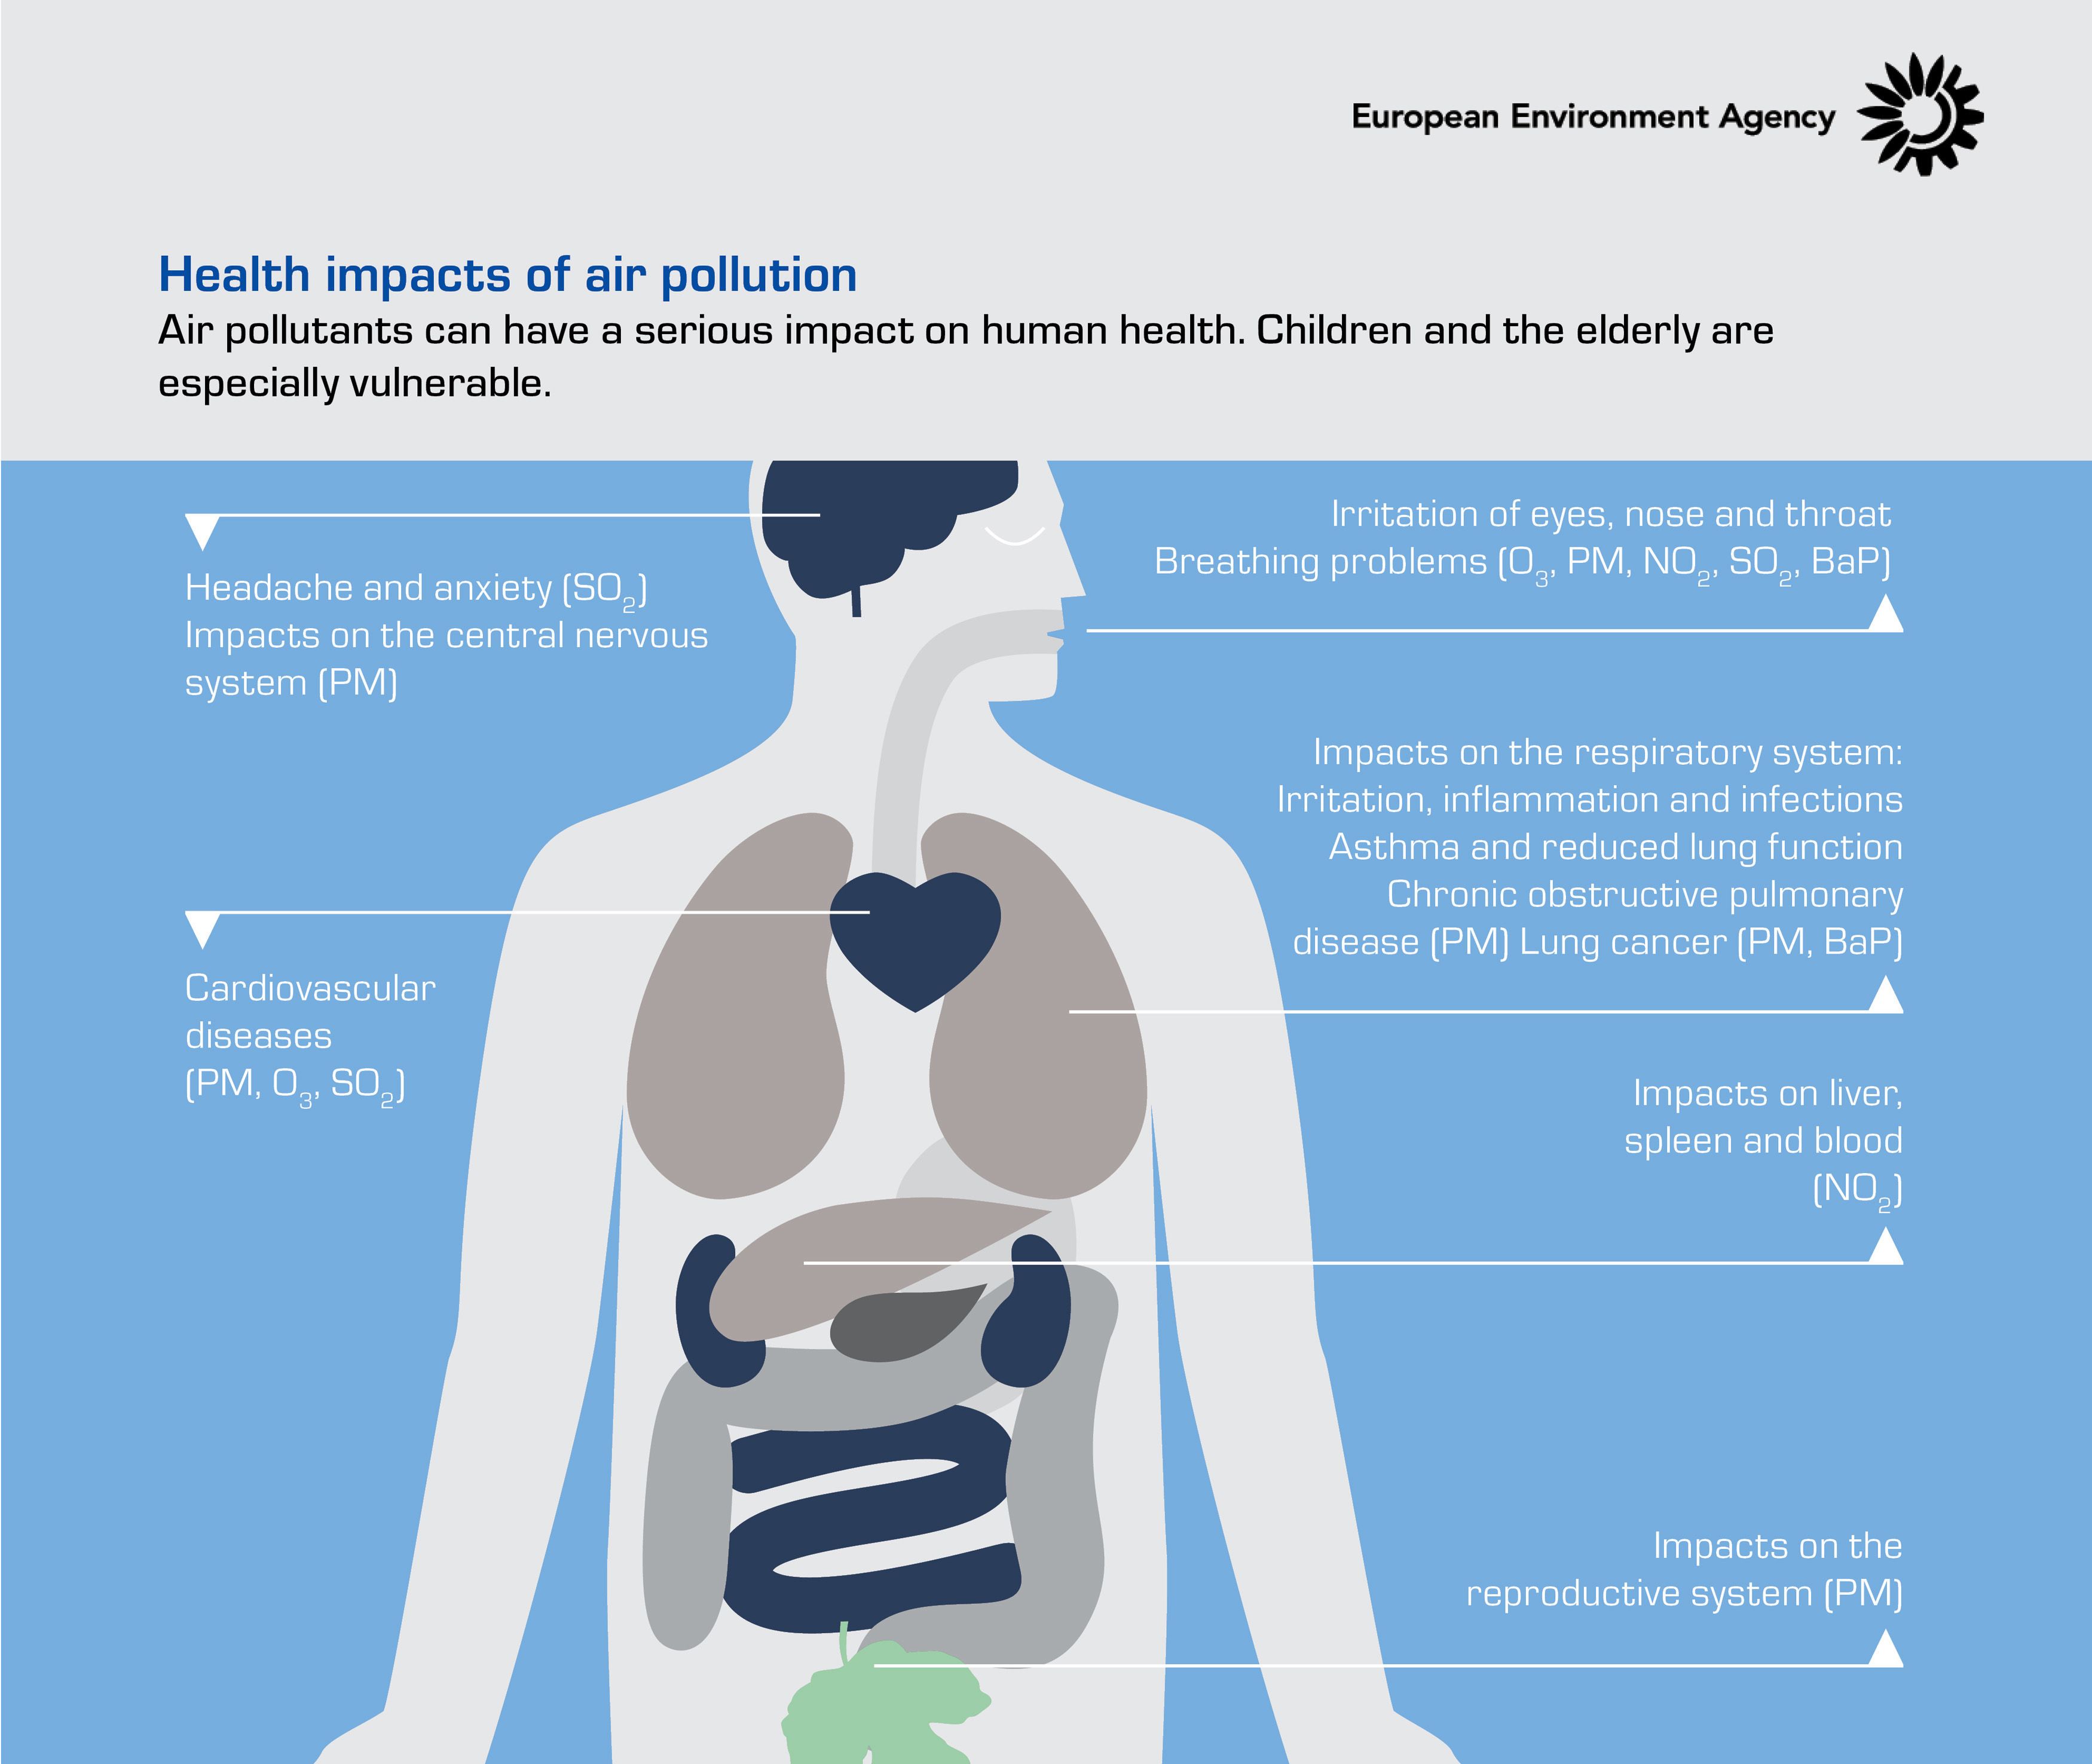
Health impacts of air pollution. Credit: EEA.
Health impacts of air pollution. Credit: EEA.
Understanding atmospheric composition using CAMS data


CAMS draws on Earth observations combined with numerical models of weather and atmospheric composition to create detailed analyses and forecasts of atmospheric composition and air quality. These data are used for initialising forecasts of global conditions, as well as European air quality. Organisations and authorities around the world can use these forecasts to their advantage.
Meteorological organisations can use the information to improve their own services, and app developers can use it to improve existing tools or create new ones, to provide benefits to individuals, businesses and customers in specific industries. Either directly or through new services, CAMS atmospheric data are reaching millions of people, supporting industry and improving human health.
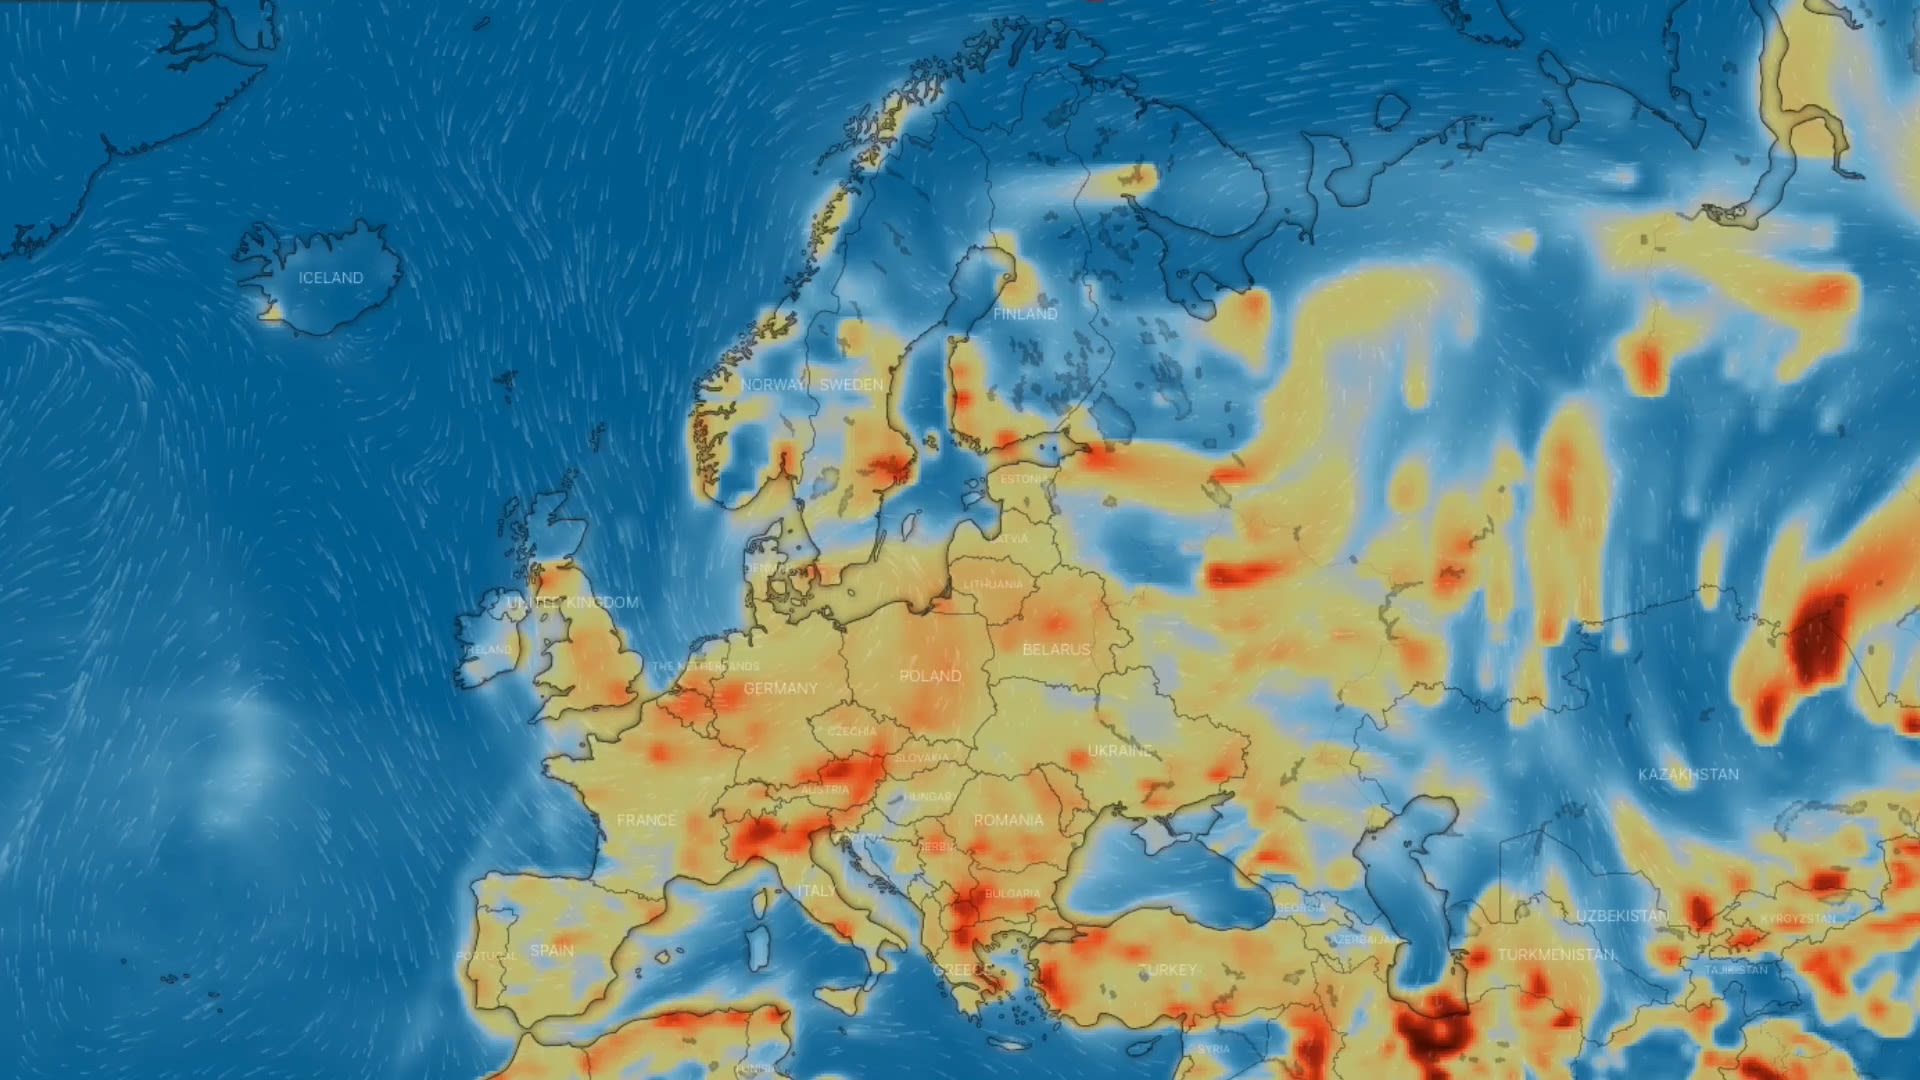
A perfect example of mixture of different aerosol sources during the ex-hurricane Ophelia case, which increased fire emissions in Portugal/Galicia, and smoke transport during October 2017. Credit: Copernicus Atmosphere Monitoring Service, ECMWF.
A perfect example of mixture of different aerosol sources during the ex-hurricane Ophelia case, which increased fire emissions in Portugal/Galicia, and smoke transport during October 2017. Credit: Copernicus Atmosphere Monitoring Service, ECMWF.
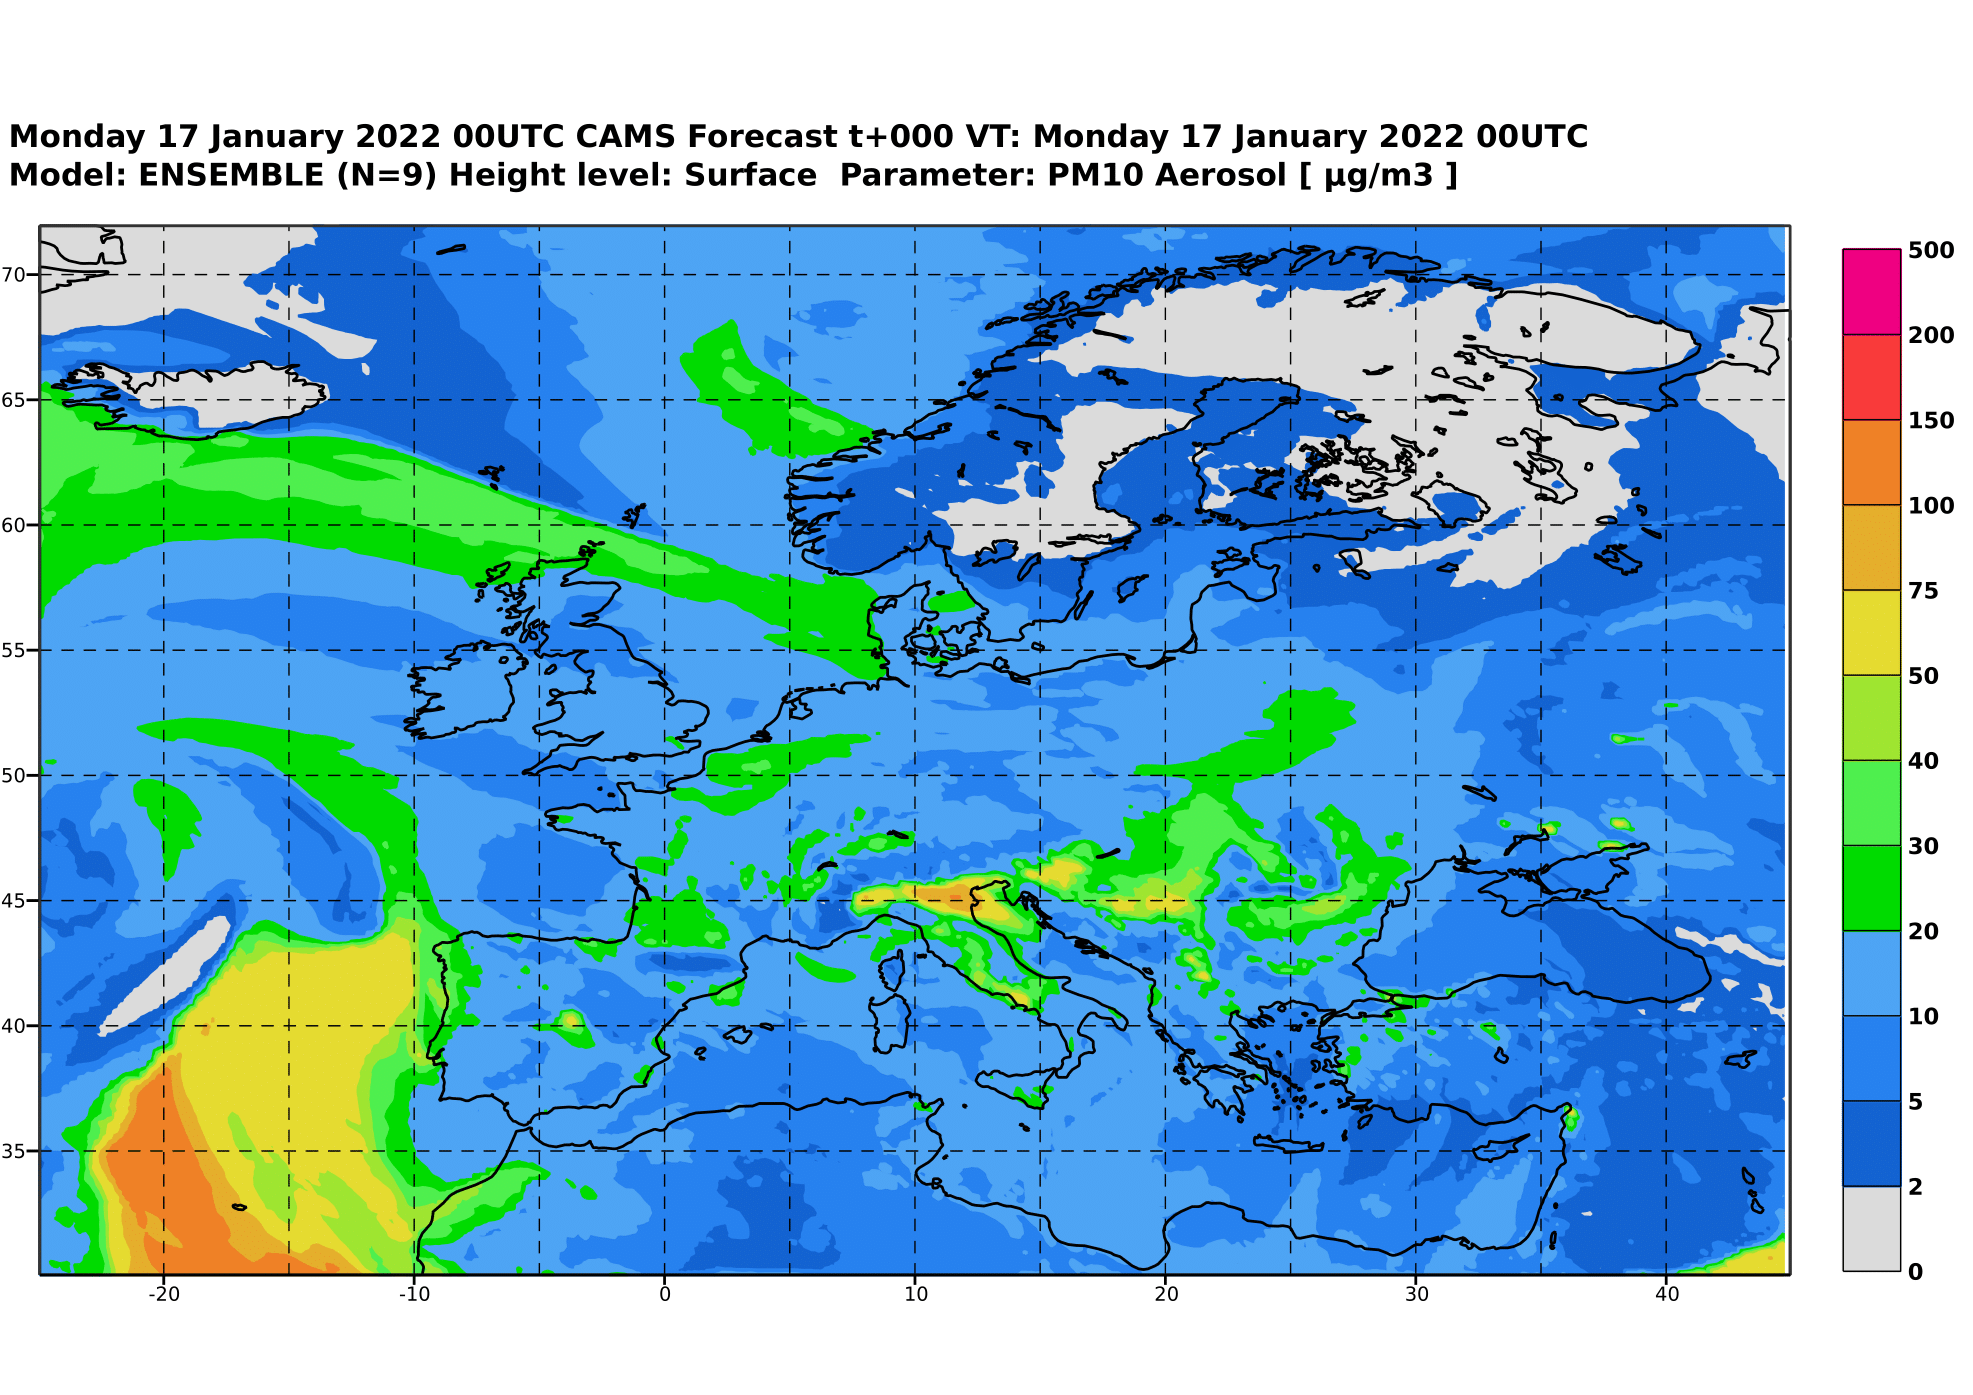
Particulate matter forecasts for Europe…
CAMS uses an ensemble of output from different air quality models to produce extensive analyses and forecasts for air quality. The European ensemble is based on nine numerical air quality models created by organisations across Europe. Data on a variety of atmospheric pollutants are provided, including PM2.5 and PM10, and also PM1 – ultrafine particulate matter.
Link to CAMS European air quality forecasts dataset
The data are also provided in a simple visual format that allows users to select by variable, and to explore data for major European cities including European Capitals.
Link to CAMS European air quality forecast

…and the globe
CAMS also provides global forecasts of atmospheric composition for more than 50 chemical species, again including the different classifications of particulate matter.
Link to CAMS global atmospheric composition forecasts dataset
As well as the European and global quality-controlled datasets, which can be freely downloaded by any user, CAMS offers a range of easy-to-understand data visualisations.
The charts, which cover all regions of the globe at three-hour time steps up to five days ahead, include particulate matter forecasts for PM2.5 and PM10, which are calculated from the concentrations of different aerosol species, including dust.
These charts allow anyone to explore the big picture of the widespread impact of the movement of particulate matter.
Link to particulate matter forecast chart
Boris Quennehen, Atmospheric scientist at Plume Labs:
“The data downloaded through the online services is very convenient to use and we are very happy with the quality and reliability of the services. We use a range of data which covers the monitored air quality pollutants (NO2, SO2, CO, O3, PM2.5 and PM10).”


Using CAMS
atmospheric data
for downstream applications


The datasets CAMS produces on air quality, including particulate matter, are free to be used by authorities, researchers, and other organisations and individuals. The data can be used on their own or can be fed as an input into new applications, or used to improve existing applications, that make the data more meaningful to users.


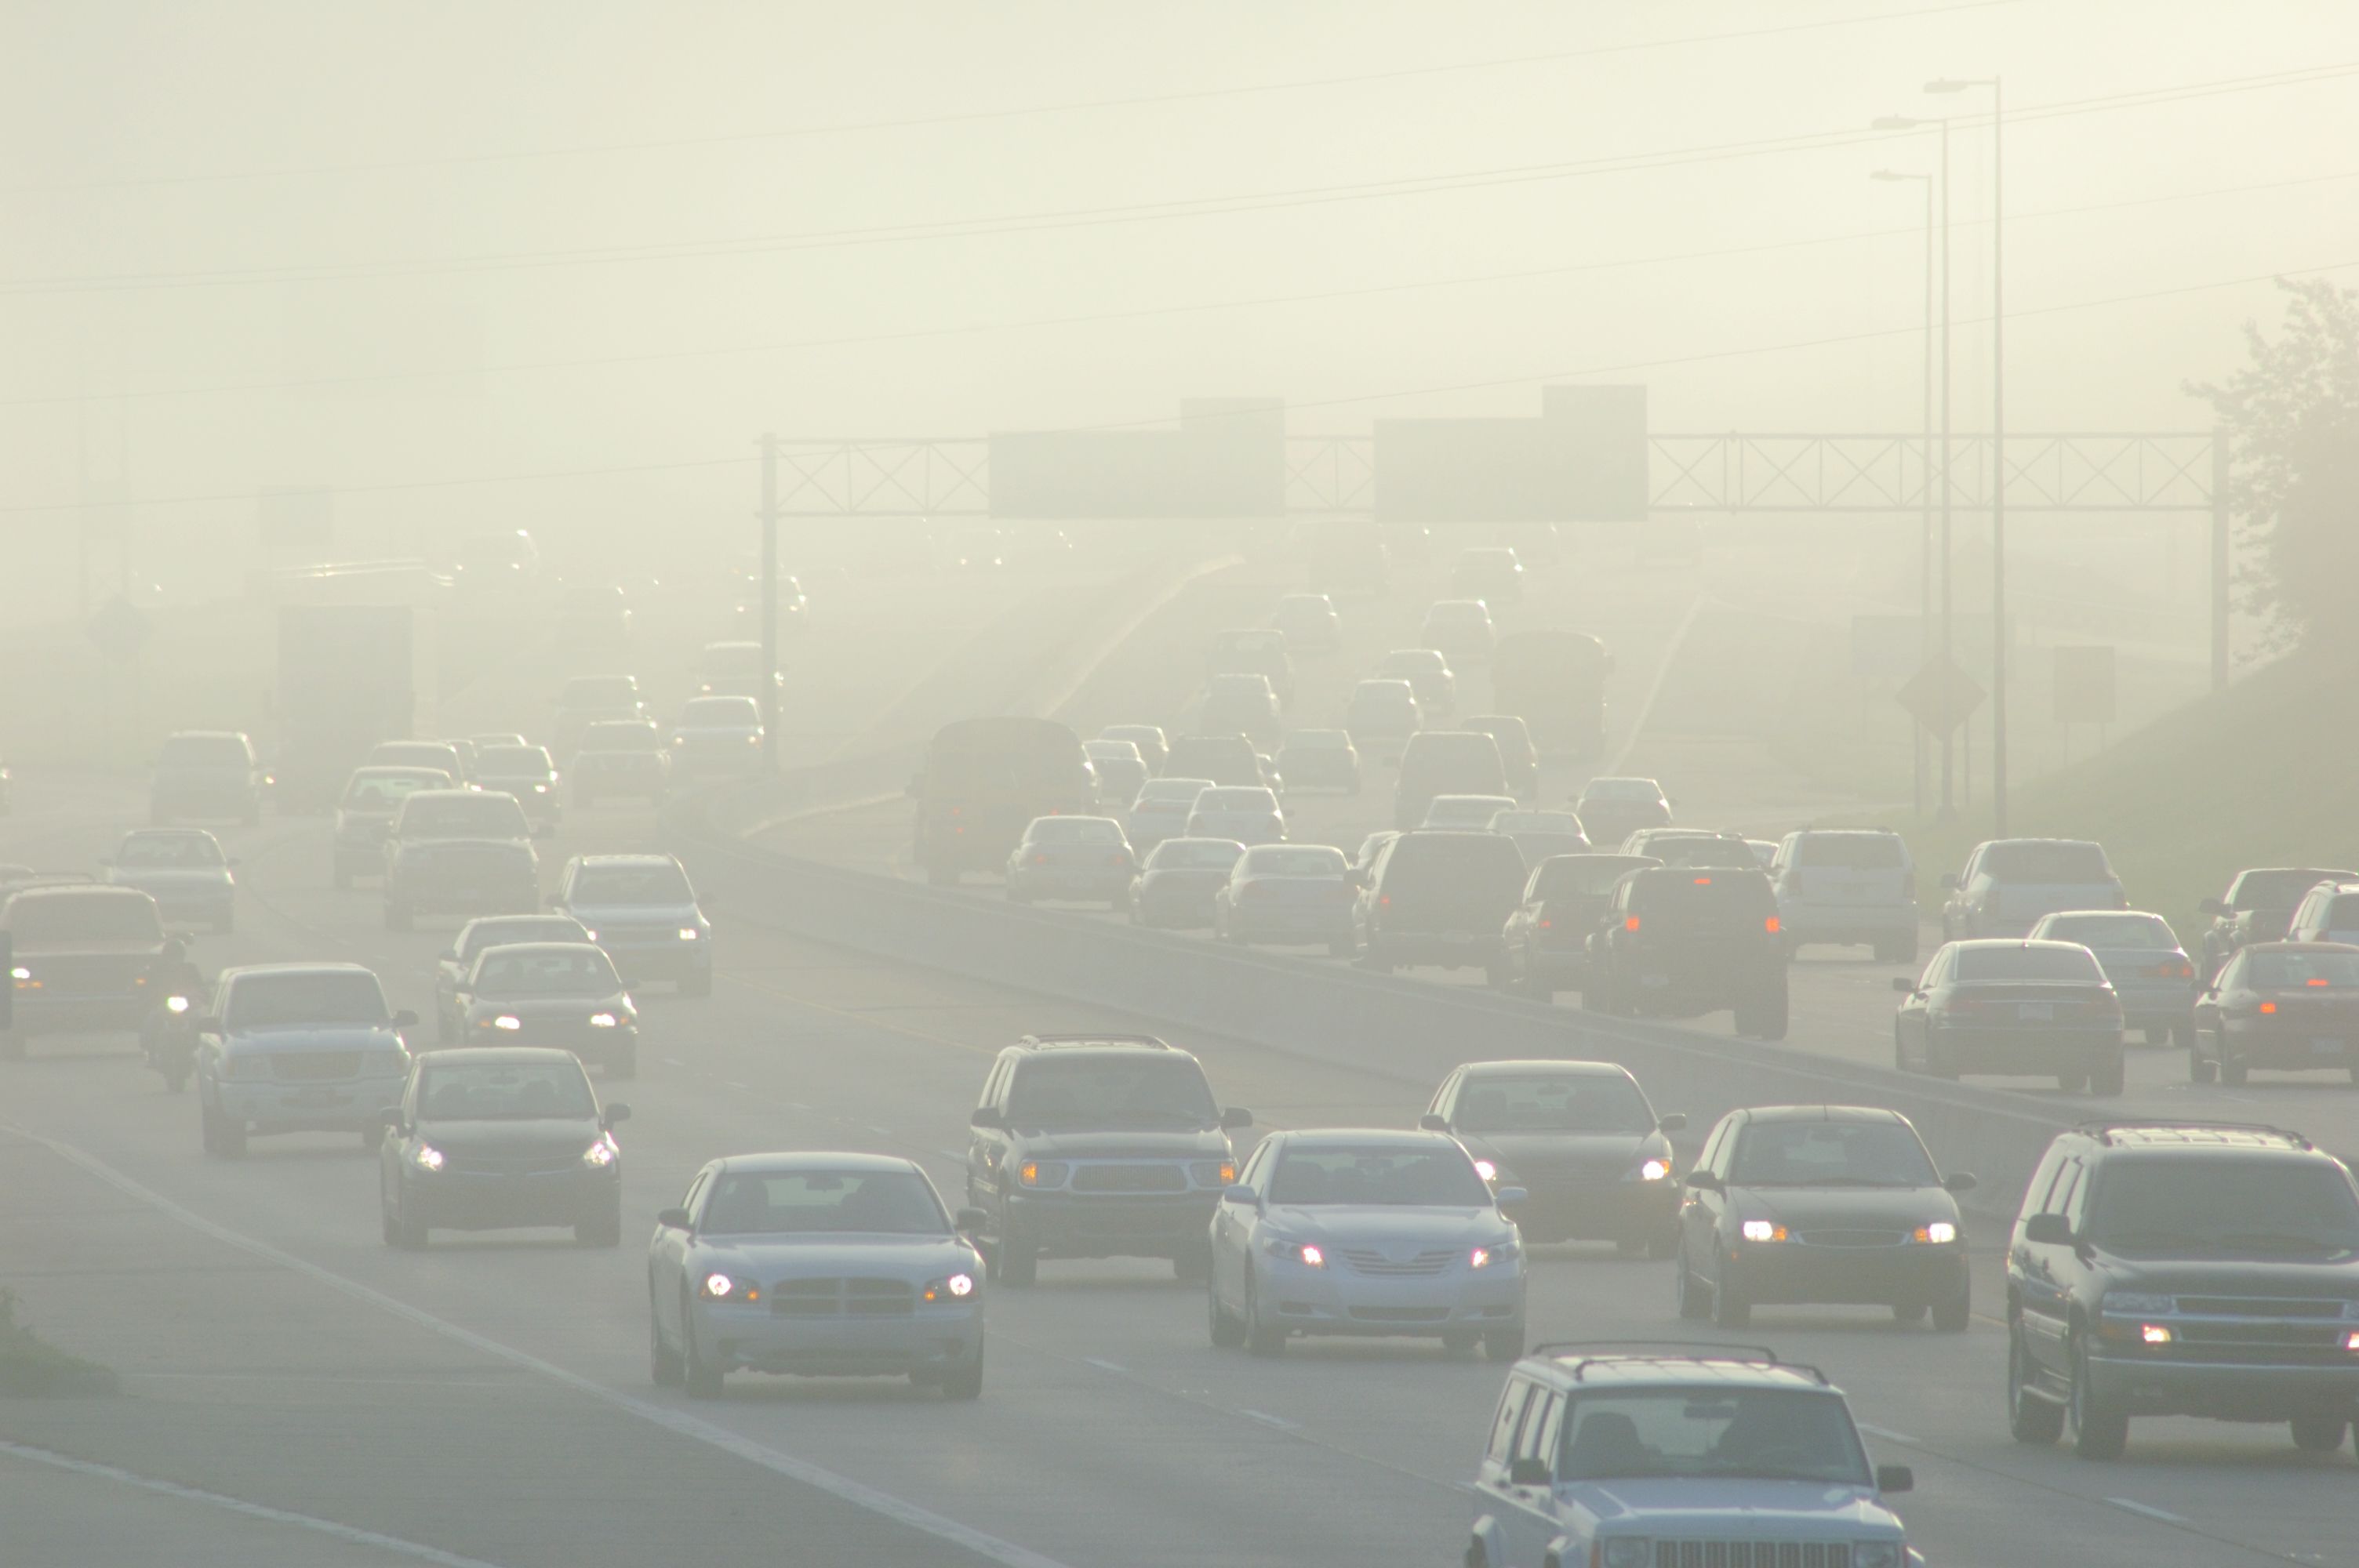
Pollutants in the air such as smoke, dust and sand can cause disruption for the transport industry.
The constant presence of particulate matter in the atmosphere can damage aircraft engines and airframes. Engines, vents and filters get clogged up, affecting everything from the safety of the flight to the air conditioning. Secondary impacts such as ice seeded by dust and smoke can also cause problems even at cruise altitudes.
Predicting the movement of airborne particulate matter would allow the aviation sector to understand flying conditions, and when it was appropriate to re-route or ground aircraft. Reliable data would also support airline companies plan maintenance, by calculating longer-term impacts.


The airline industry can use the information CAMS provides to calculate indicators of damage from particulate matter in aircraft, such as abrasion or clogging.


AsSISt
The Aircraft Support & Maintenance Services (AsSISt) programme uses CAMS atmospheric data to helping the aviation industry navigate the potential risks of particulate matter damage.
Air quality information is used to compute the levels of damage that may happen to aircraft.
AsSISt was developed by Capgemini, a French technology services and digital transformation company, in partnership with the French National Institute for Industrial Environment and Risks, and the Barcelona Supercomputing Center.


The reliable data CAMS produces allow AsSISt to calculate three key indicators of atmospheric conditions: abrasion, clogging, and corrosion. This helps users plan maintenance schedules, depending on the expected damage. AsSISt also supports airlines to re-route flights, to reduce maintenance to cost ratios.
Maintenance plans are adapted to individual aircraft, taking into account the level of wear they may be vulnerable to. This is based on variables such as an aircraft’s regular routing – a domestic European flight will not experience as much damage as much as one regularly flying across arid desert countries, such as in the Middle East or Africa. This is down to the levels of particulate matter along the route as well as atmospheric conditions.
By using AsSISt, powered by CAMS data, airlines can adjust regular routes to mitigate the impacts of particulate matter. This could lead to huge reductions in maintenance costs over time. When aircraft parked or stored in hangars, they are still susceptible to damage from particulate matter. The aviation industry can use AsSISt when deciding where to park, where to store spare parts, and where to build maintenance centres. Overall, these changes could make the airline industry far more efficient and bring down costs.
As well as tools for industry,
CAMS data are used to
power applications used by
governments, organisations
and individuals.
One of these applications
is the weather forecast
visualisation service, Windy.


CAMS’ partnership with Windy aims to deliver global air quality information through Windy’s popular web and smartphone application.
Windy’s tools show a high-resolution map, overlaid with easily understood visuals of various weather elements. The partnership with CAMS provides information on PM2.5, as well as nitrogen dioxide, aerosols, the ozone layer, fire intensity, surface ozone and sulphur dioxide.
Vincent-Henri Peuch, Director of CAMS, says:
“We are delighted that Windy has integrated CAMS data, so that its many users can access our global and European air quality forecasts. To help inform, mobilise and eventually combat air pollution, air quality forecasts need to become as common as weather forecasts. The way Windy visualises CAMS data helps people to understand that air pollution is not simply a local problem, but can be transported hundreds or thousands of kilometres by winds. Using Windy, one can easily follow where air pollution is transported and where it accumulates.”
Jan Šimek, project manager at Windy :
“The benefit of using CAMS data for Windy is that we believe that we have attracted many new users who are interested in air quality, which we didn’t have previously.”

With European citizens naming air quality as one of their top ten environmental concerns, it is vital that the public has access to accurate and timely information on the state of the atmosphere. Several applications have been developed to provide easy access to CAMS air quality information.
One of these is airTEXT.

airTEXT
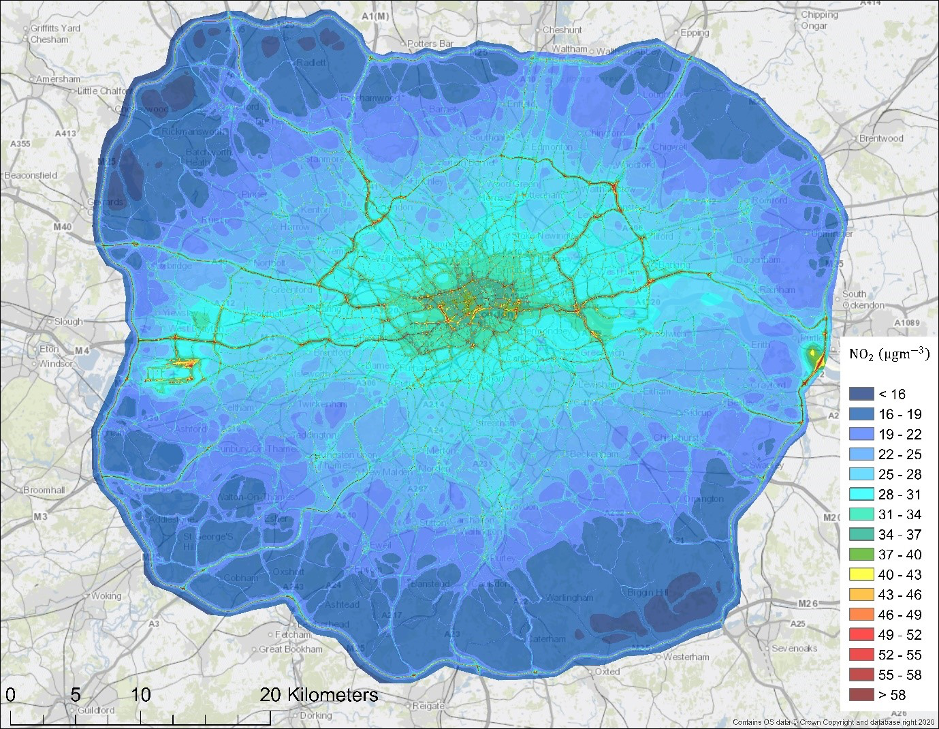
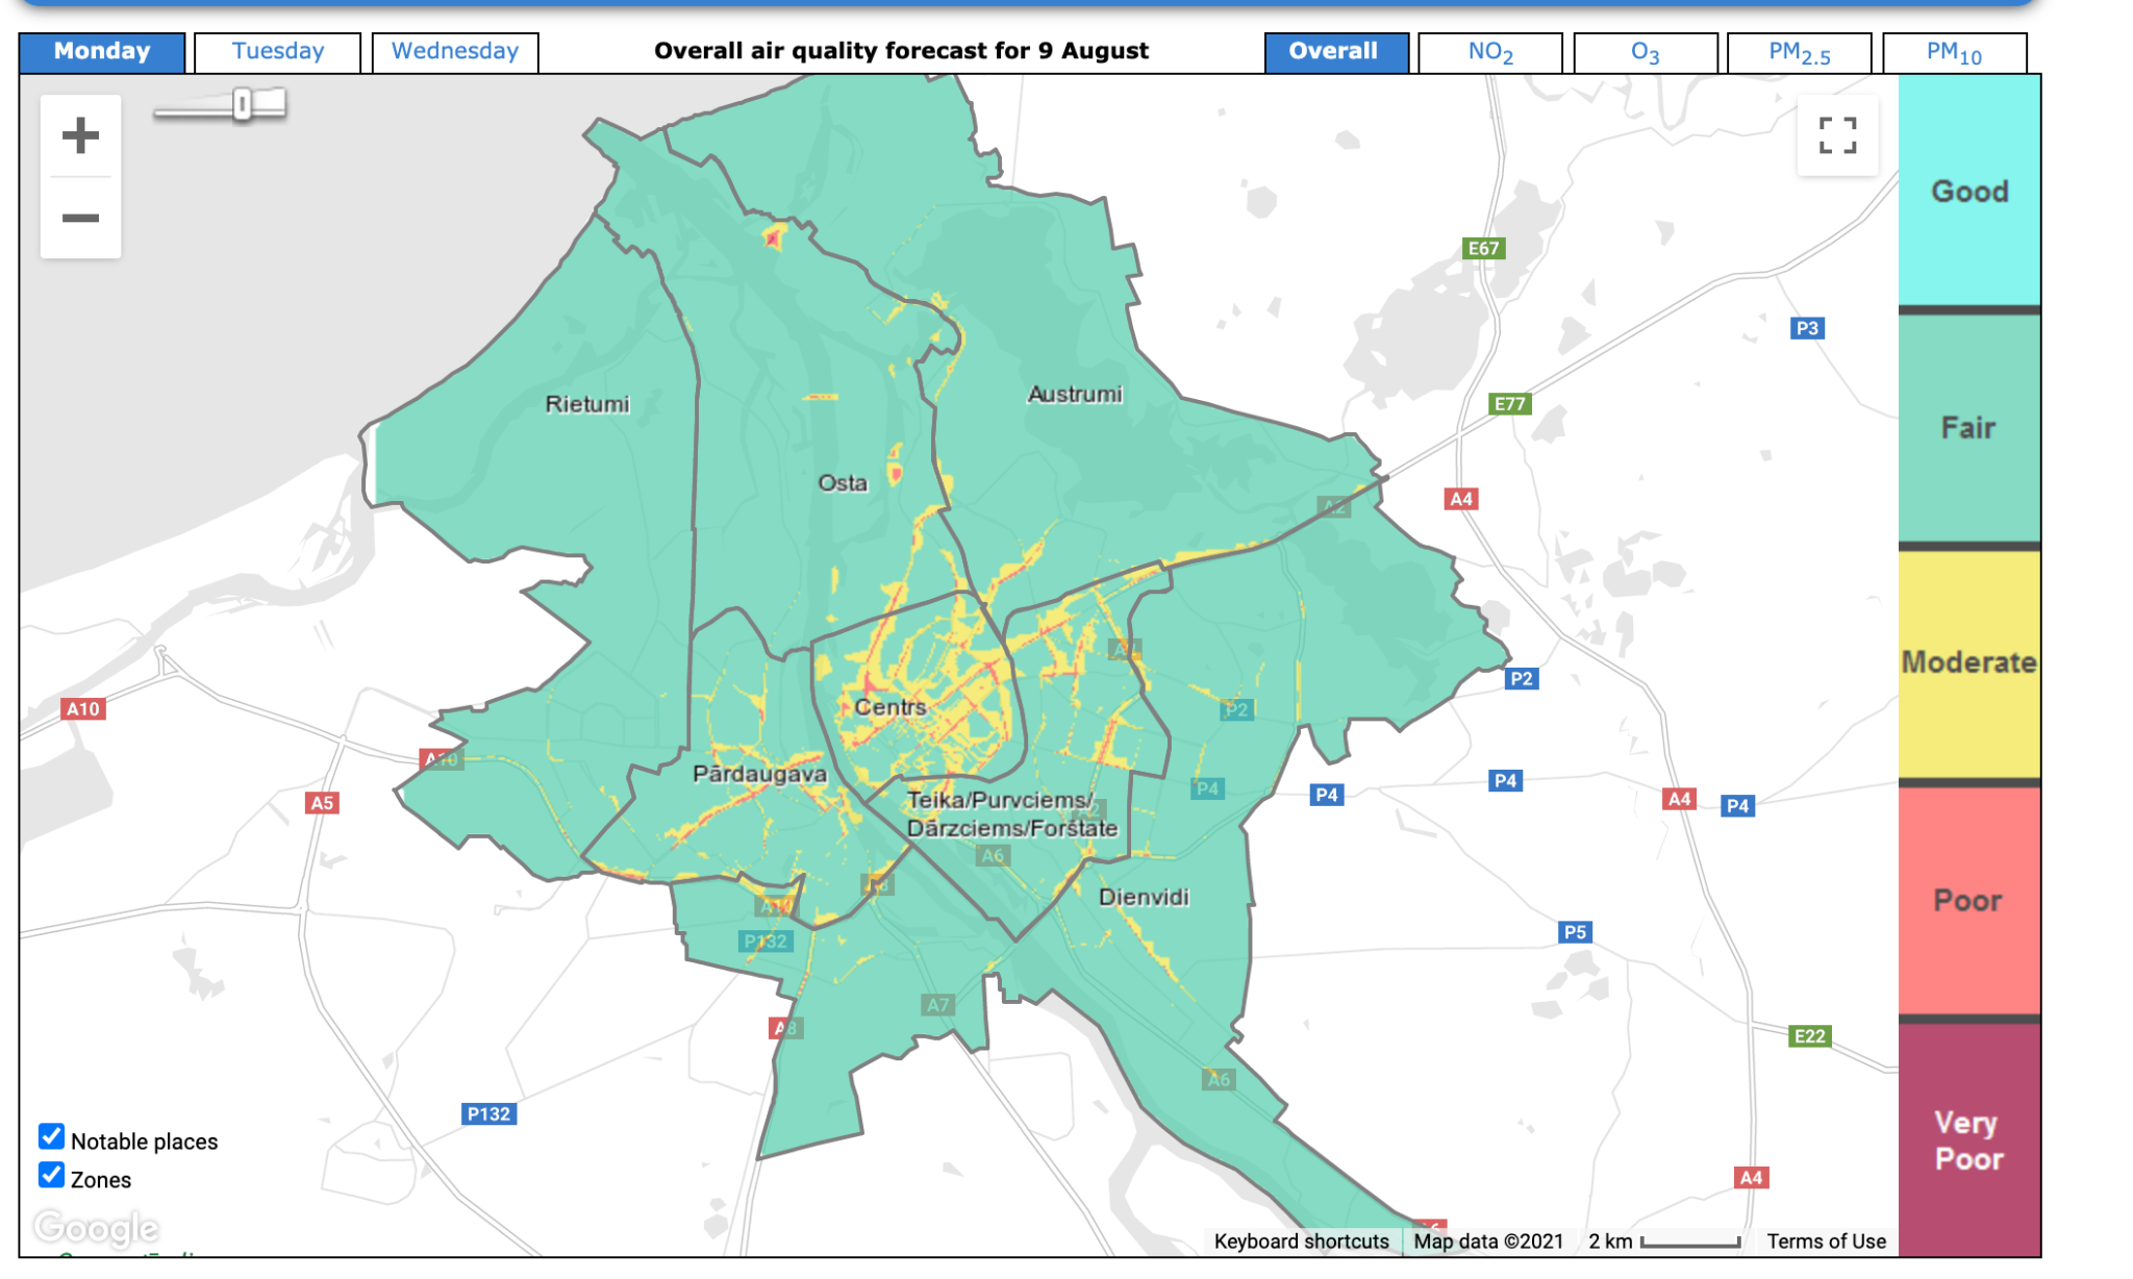
Scientists in Latvia and the UK have used CAMS data to produce a free air quality services: airTEXT. The service is available for Riga in Latvia, and London, Cambridge, Chelmsford and Colchester in the UK.
The apps draw on CAMS air quality forecasting data and combine these forecasts with air quality information from ADMS-Urban. This comprehensive system is used to model pollutant dispersion large urban areas, to show what happens on a range of scales, from individual streets to entire cities.
The service provides forecasts of local air quality up to three days ahead of time and is accessible through a website or on a free mobile app. Free text and email alerts are also available to push information to the public about local air quality, keeping people informed.


Forecasting air quality to improve livelihoods and respiratory health
CAMS data help residents prepare for air pollution events and reduce associated risks. The data can also be used more generally to improve air quality within cities, driving new initiatives for cleaner air.


The United Nations’ Sustainable Development Goal SDG 3 seeks to improve the health and well-being of all societies. CAMS forecasts are contributing to this goal by ensuring that the highest-quality information about air pollution is at the fingertips of citizens across Europe.
SDG 11 aims to make cities and human settlements inclusive, safe, resilient and sustainable. CAMS forecasts are helping local authorities, NGOs, environmental agencies and citizens track the air quality within their cities.