Real-world applications of the Climate Change Adaptation Digital Twin


Back to ECMWF - Destination Earth main page
Following Destination Earth’s co-design vision to create a new type of information system that responds to the needs of the impact sectors, the Climate Change Adaptation Digital Twin (Climate DT) relies on several use cases covering different sectors that heavily depend on improved climate information.
Finland’s CSC-IT Center for Science, which is leading a consortium of international agencies that is developing the Climate DT, has selected partners to test the performance of its system for Energy, Wildfires, Hydrology, Hydrometeorology and Urban applications.
The European Centre for Medium-Range Weather Forecasts (ECMWF) has contracted the creation of the Climate DT to CSC-IT Center for Science. It will deliver km-scale simulations from global to national and regional levels at multi-decadal timescales, including uncertainty quantification. The Climate DT is based on the ICON model and ECMWF’s IFS model coupled with the FESOM model, for sea ice, and NEMO, for the ocean, with a specific configuration developed by the H2020 project NextGEMS.
In addition to demonstrating the performance and the relevance of the Climate DT applications, the use cases play a role in shaping the information system, since users will provide inputs throughout the process. As a result, the Climate DT will better respond to the real needs of the real end users.
“The use cases have a prominent role in DestinE. Beyond the more traditional demonstration and testing contribution, they are truly involved in the design of the system and have their say in the final output. In this regard I think the EU initiative can really make a difference, this codesign approach is one of the key ingredients that will make DestinE a new type of weather and climate information system.” says Sami Niemelä, Director of Meteorological and Marine research programme at the Finnish Meteorological Institute.
Wildfires – More detailed information about the potential evolution of wildfires
The Finnish forestry management project HIILIPOLKU and the North Karelian-Rescue Services are the key users of this use case, seeking to provide detailed information about the potential evolution of wildfires for Finland, initially and for the Northern Hemisphere at further stages.
The application will combine the mechanistic fire model Spitfire, of which a Python version was created especially for this use case, with the Prometheus fire growth model, developed by several Canadian agencies and the Canadian forest fire weather index.
The combination of adjustable fuel, landscape pattern and topography information and the data from the Climate DT runs on the LUMI supercomputer will provide enhanced simulations of the potential evolution of wildfires in a changing climate.

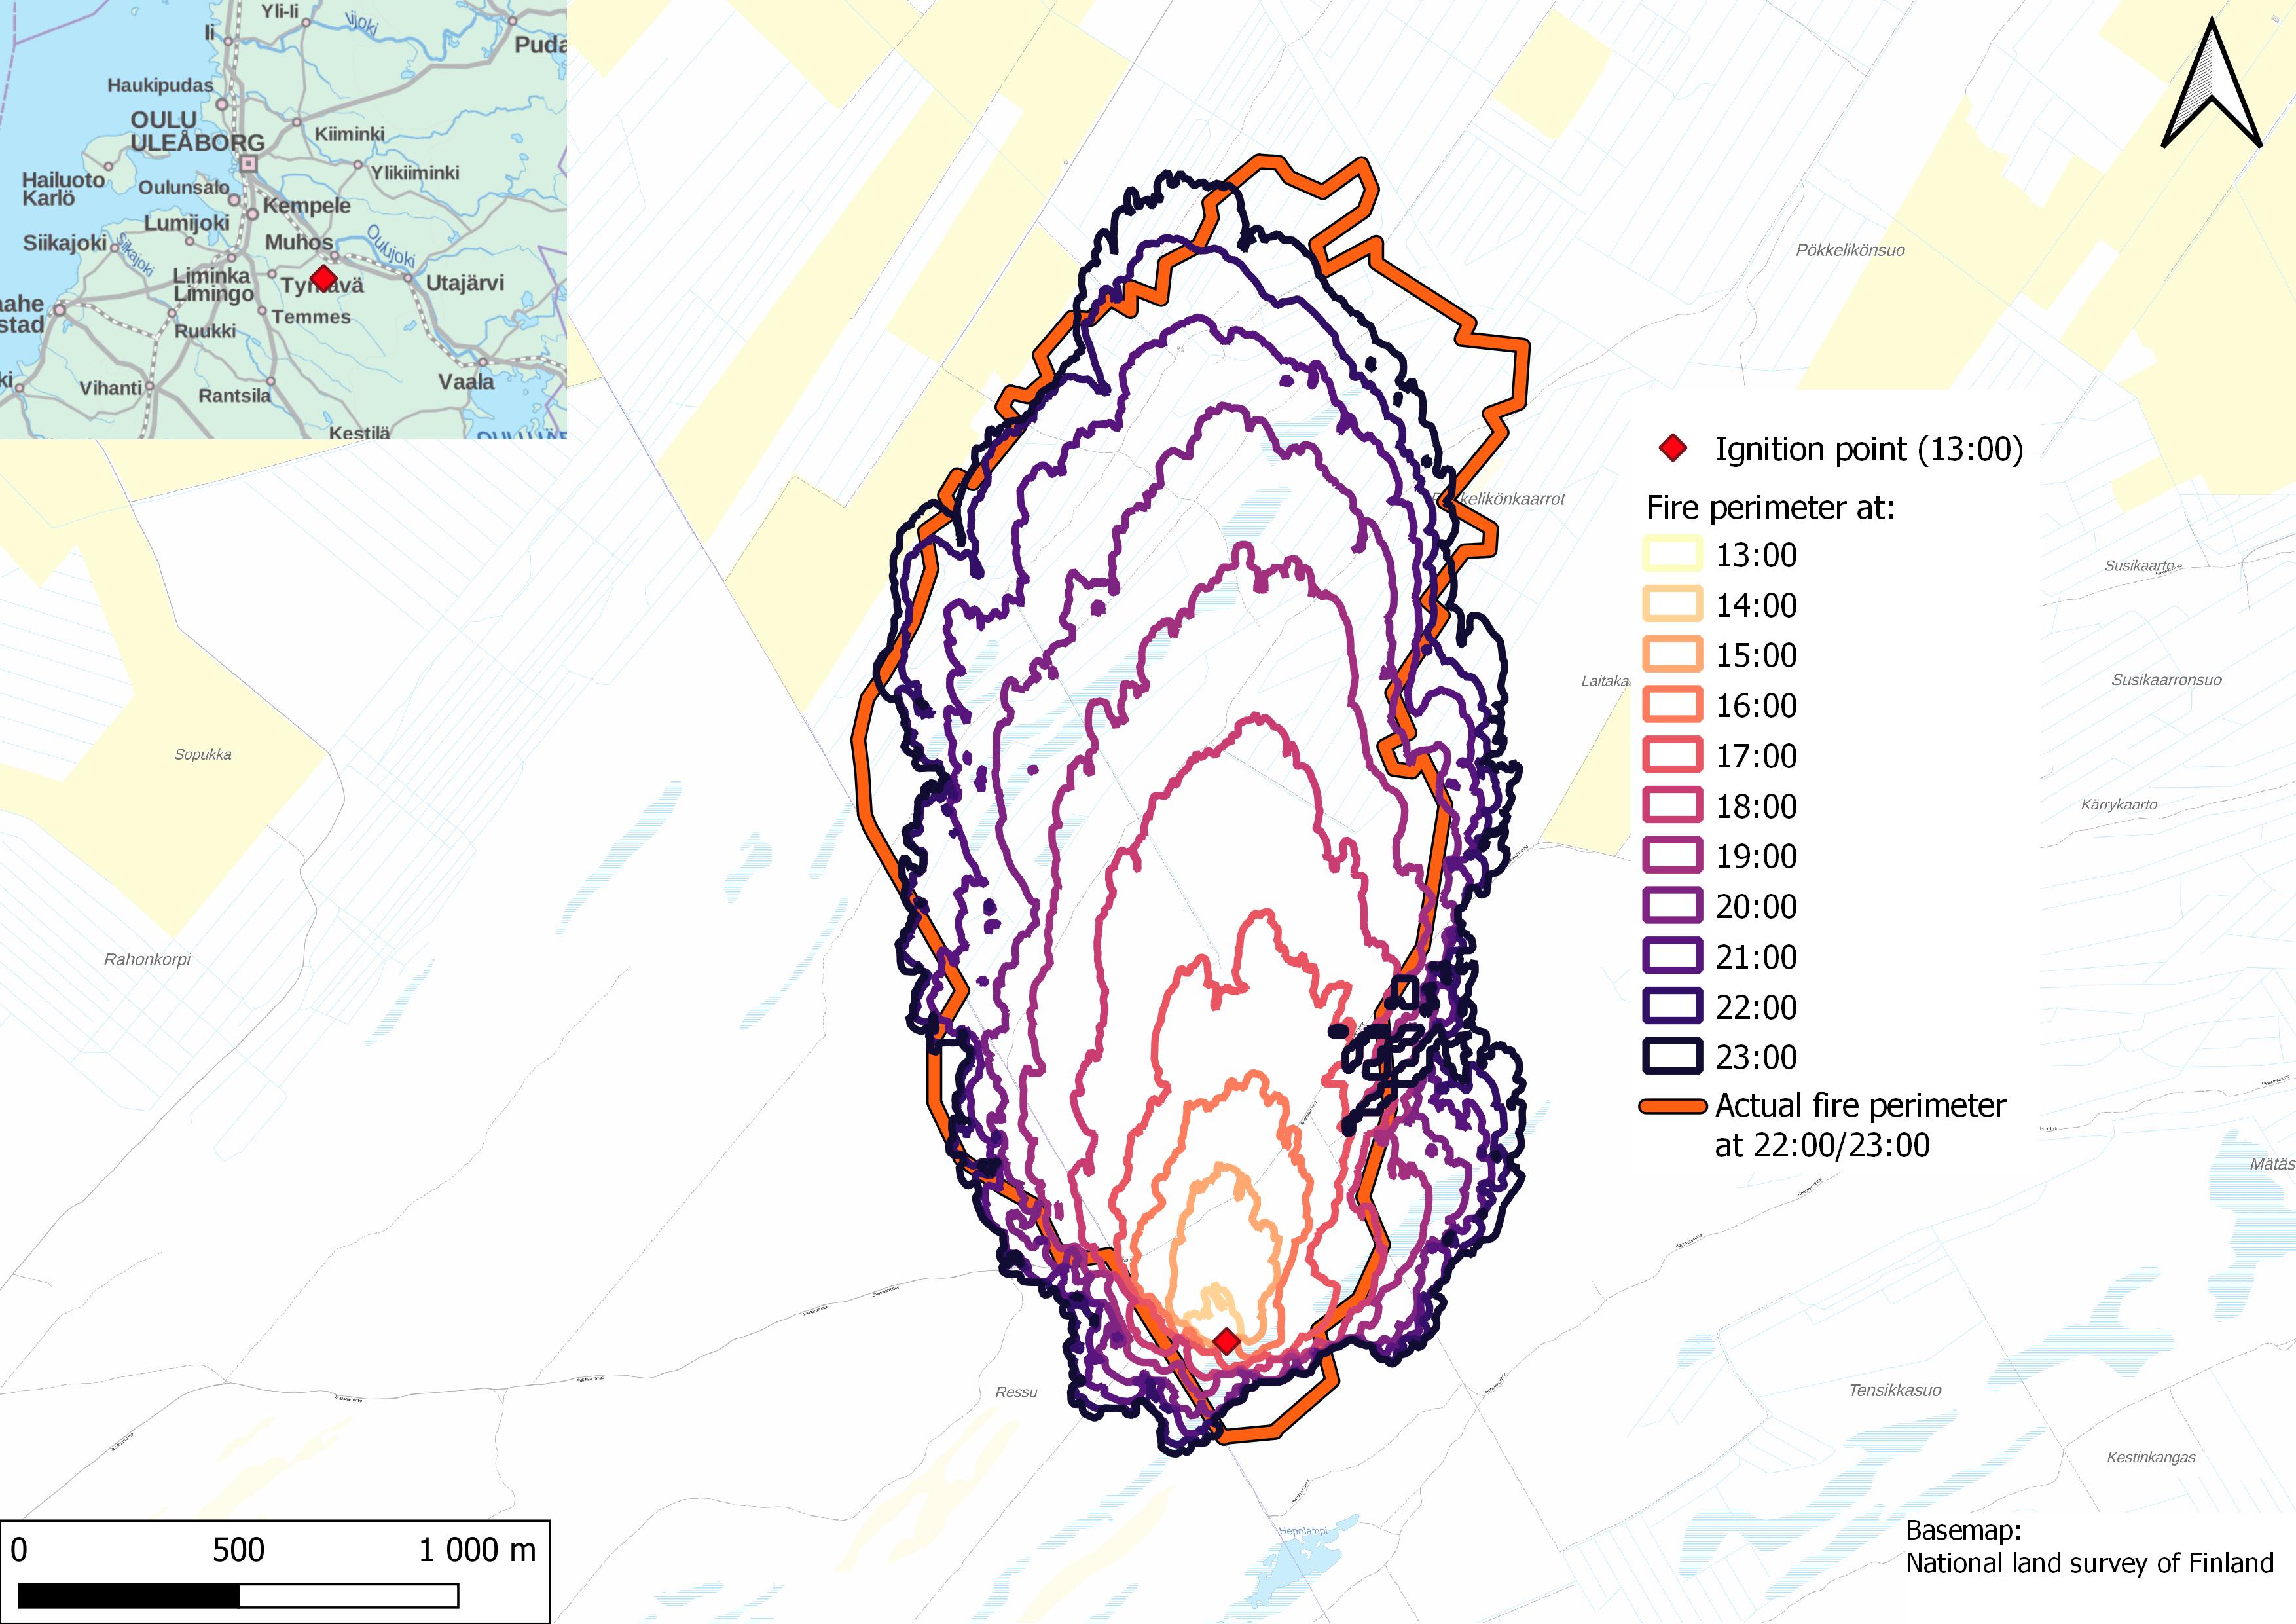
Simulation of forest fire spread in Muhos, Finland on 29.6.2020, where the fire burned an 250 hectare area within a 10 hour period. Red curve shows burned area at 22-23 EET and thin coloured lines show fire spread at one hour interval after ignition simulated by Prometheus. Credit: FMI
Simulation of forest fire spread in Muhos, Finland on 29.6.2020, where the fire burned an 250 hectare area within a 10 hour period. Red curve shows burned area at 22-23 EET and thin coloured lines show fire spread at one hour interval after ignition simulated by Prometheus. Credit: FMI
This use case aims at providing a refined view of wildfire risks in a changing climate by combining the applications involved with the capabilities of the Climate DT. The project aims at developing tools for assessing the present and future wildfire risk and potential solutions applicable to the Northern Hemisphere, even though the initial experiments will apply only to Finland.
Decision-makers will have improved information for risk estimation and adaptation policies at spatial scales similar to those used operationally by fire forecast and emergency services. High resolution input data from users on landscape patterns and fuel amount to the wildfire application allows to quantify to what extent land use and forestry practices influence fire risk.

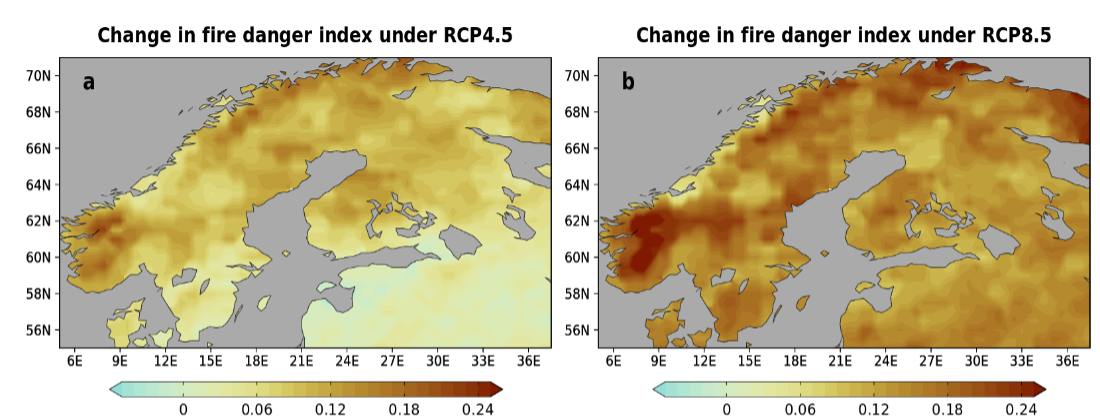
Projected change in fire danger index in Fennoscandia during summer months (JJA) from the period 1981–2010 to 2071–2100 under the RCP4.5 and RCP8.5 climate change scenarios as simulated using the Spitfire model. The model was driven with CORDEX data based on the global driver model CanESM2. Credit: FMI
Projected change in fire danger index in Fennoscandia during summer months (JJA) from the period 1981–2010 to 2071–2100 under the RCP4.5 and RCP8.5 climate change scenarios as simulated using the Spitfire model. The model was driven with CORDEX data based on the global driver model CanESM2. Credit: FMI
By providing a better understanding of wildfire risk and spreading characteristics related to the landscape variability, this application may benefit users such as policymakers and experts through specialised centres such as EFFIS - European Forest Fire Information System, and national and international adaptation bodies involved in adaptation policies, e.g. the EEA (European Environment Agency).
Hydrology – Understanding changes in the water cycle
With this use case the Climate DT will be able to provide global estimates of river runoff at a spatial scale of 5 km spatial scales and up to 1 hour, substantially more detailed than the current hydrology information systems. The HydroRiver application is based on the mesoscale Hydrologic Model (mHM), a well-established model used operationally by the German Drought Monitor, and the multiscale Routing Model (mRM), both developed by Germany’s Helmholtz Centre for Environmental Research (UFZ). The main users are DVGW (German Technical and scientific Association for Gas and Water) and EEA (European Environment Agency).
The mHM is used operationally by ECMWF in delivering the Copernicus Climate Change Service (C3S) to provide global seasonal hydrological forecasts and has also served for research, among others, about the impacts of climate change in flooding and droughts in Europe.

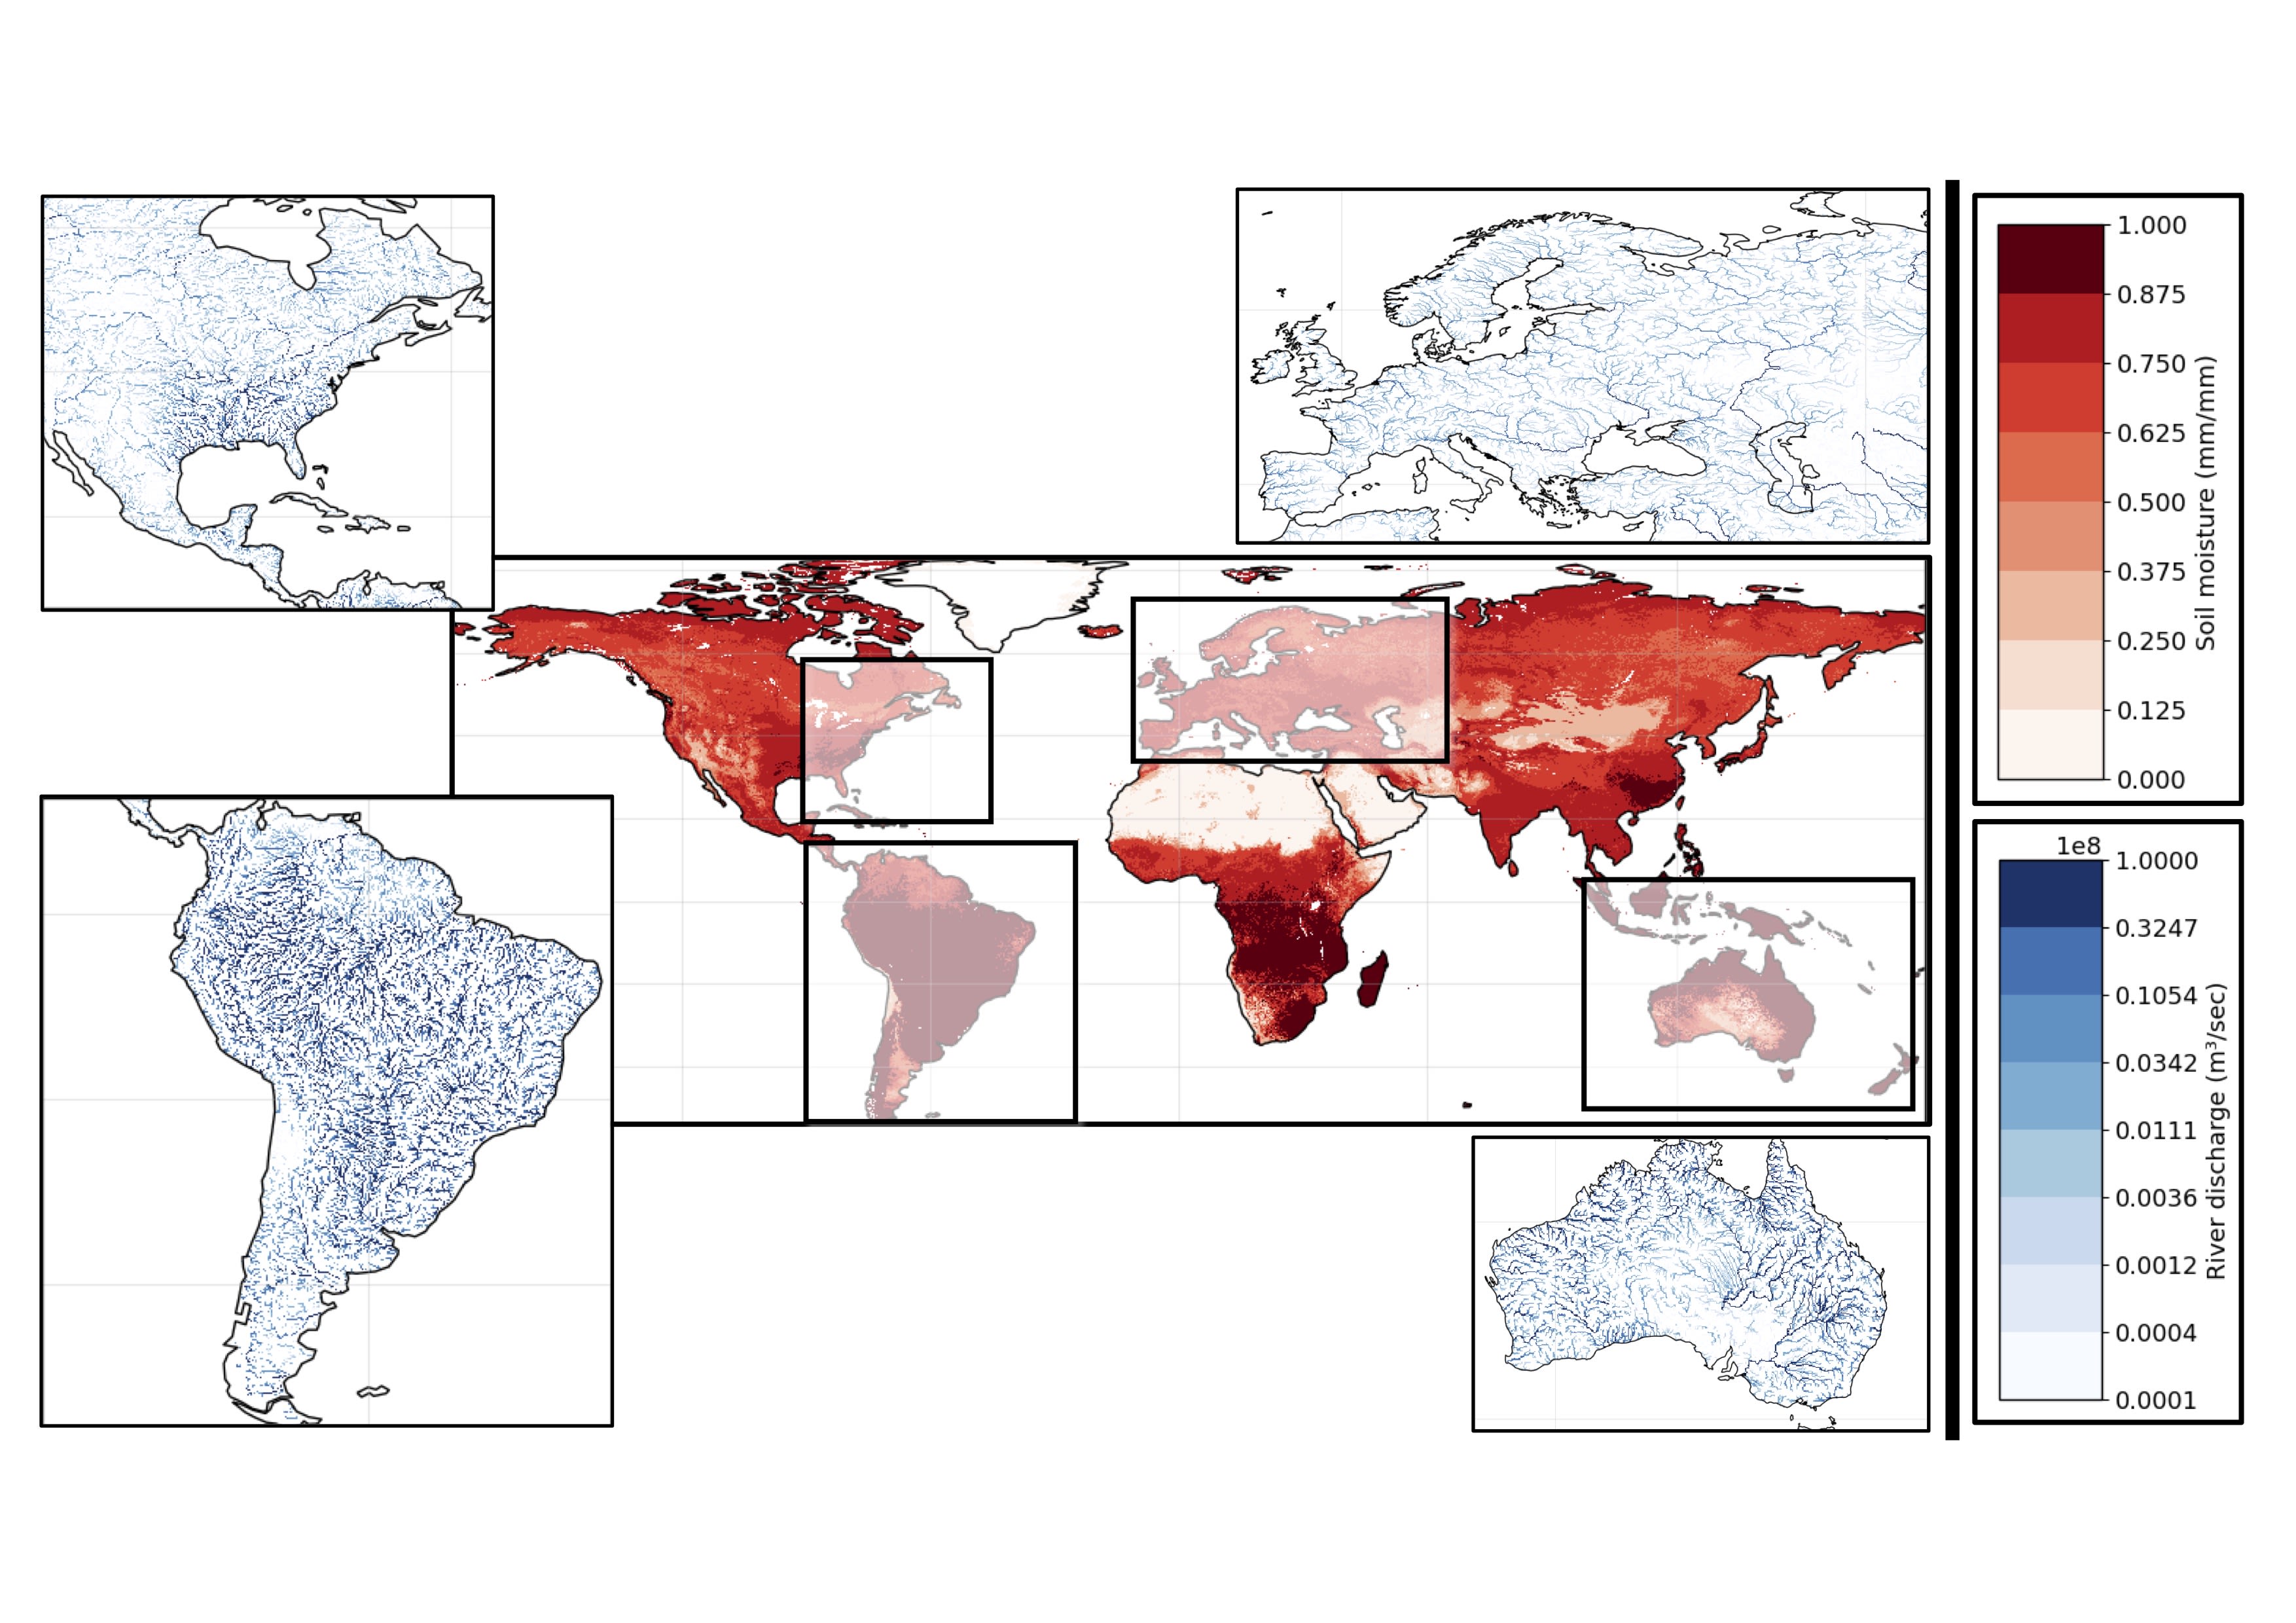
Global mean soil moisture (in red), and mean river discharge (in blue, zoomed in to show the high-resolution of the river networks) for the years February 2020-February 2022. The mHM model (using the results from the NextGEMS Cycle2) as a meteorological forcing, and provided output variables representing various freshwater components (e.g., discharge, soil-moisture). Credit: ufz.de
Global mean soil moisture (in red), and mean river discharge (in blue, zoomed in to show the high-resolution of the river networks) for the years February 2020-February 2022. The mHM model (using the results from the NextGEMS Cycle2) as a meteorological forcing, and provided output variables representing various freshwater components (e.g., discharge, soil-moisture). Credit: ufz.de
The application consists of a “wrapping” software built around the mHM model that makes the interface with the climate DT and adapts the model to the global scale with the spatial and temporal resolution required.
The "HydroRiver" application will provide data about a wide range of hydrological variables and indicators depicting global freshwater availability and providing insights on the requirements for climate adaptation from global to local level in areas of particular interest.
The enhanced global river discharge application processes enormous data rates resulting from the ever-evolving DT Climate simulations, as well as additional calculations for bias correction, which are critical on applications running at such spatial and temporal scales.
The system will also provide hydrology information tailored for the impact sector with expert users and stakeholders participating in the process.
Energy – Onshore and offshore wind energy information
The shifts of climate change in weather patterns can make it difficult to anticipate the potential of power generation in a particular area. This use case will demonstrate the value of the Climate DT for informing the investment strategies of the wind power sector, focusing on offshore wind farms.
Wind resources are per se highly heterogeneous and non-stationary. Wind turbines are particularly vulnerable to extremes and climate change, and so wind farms require a very cautious and well-informed design approach.

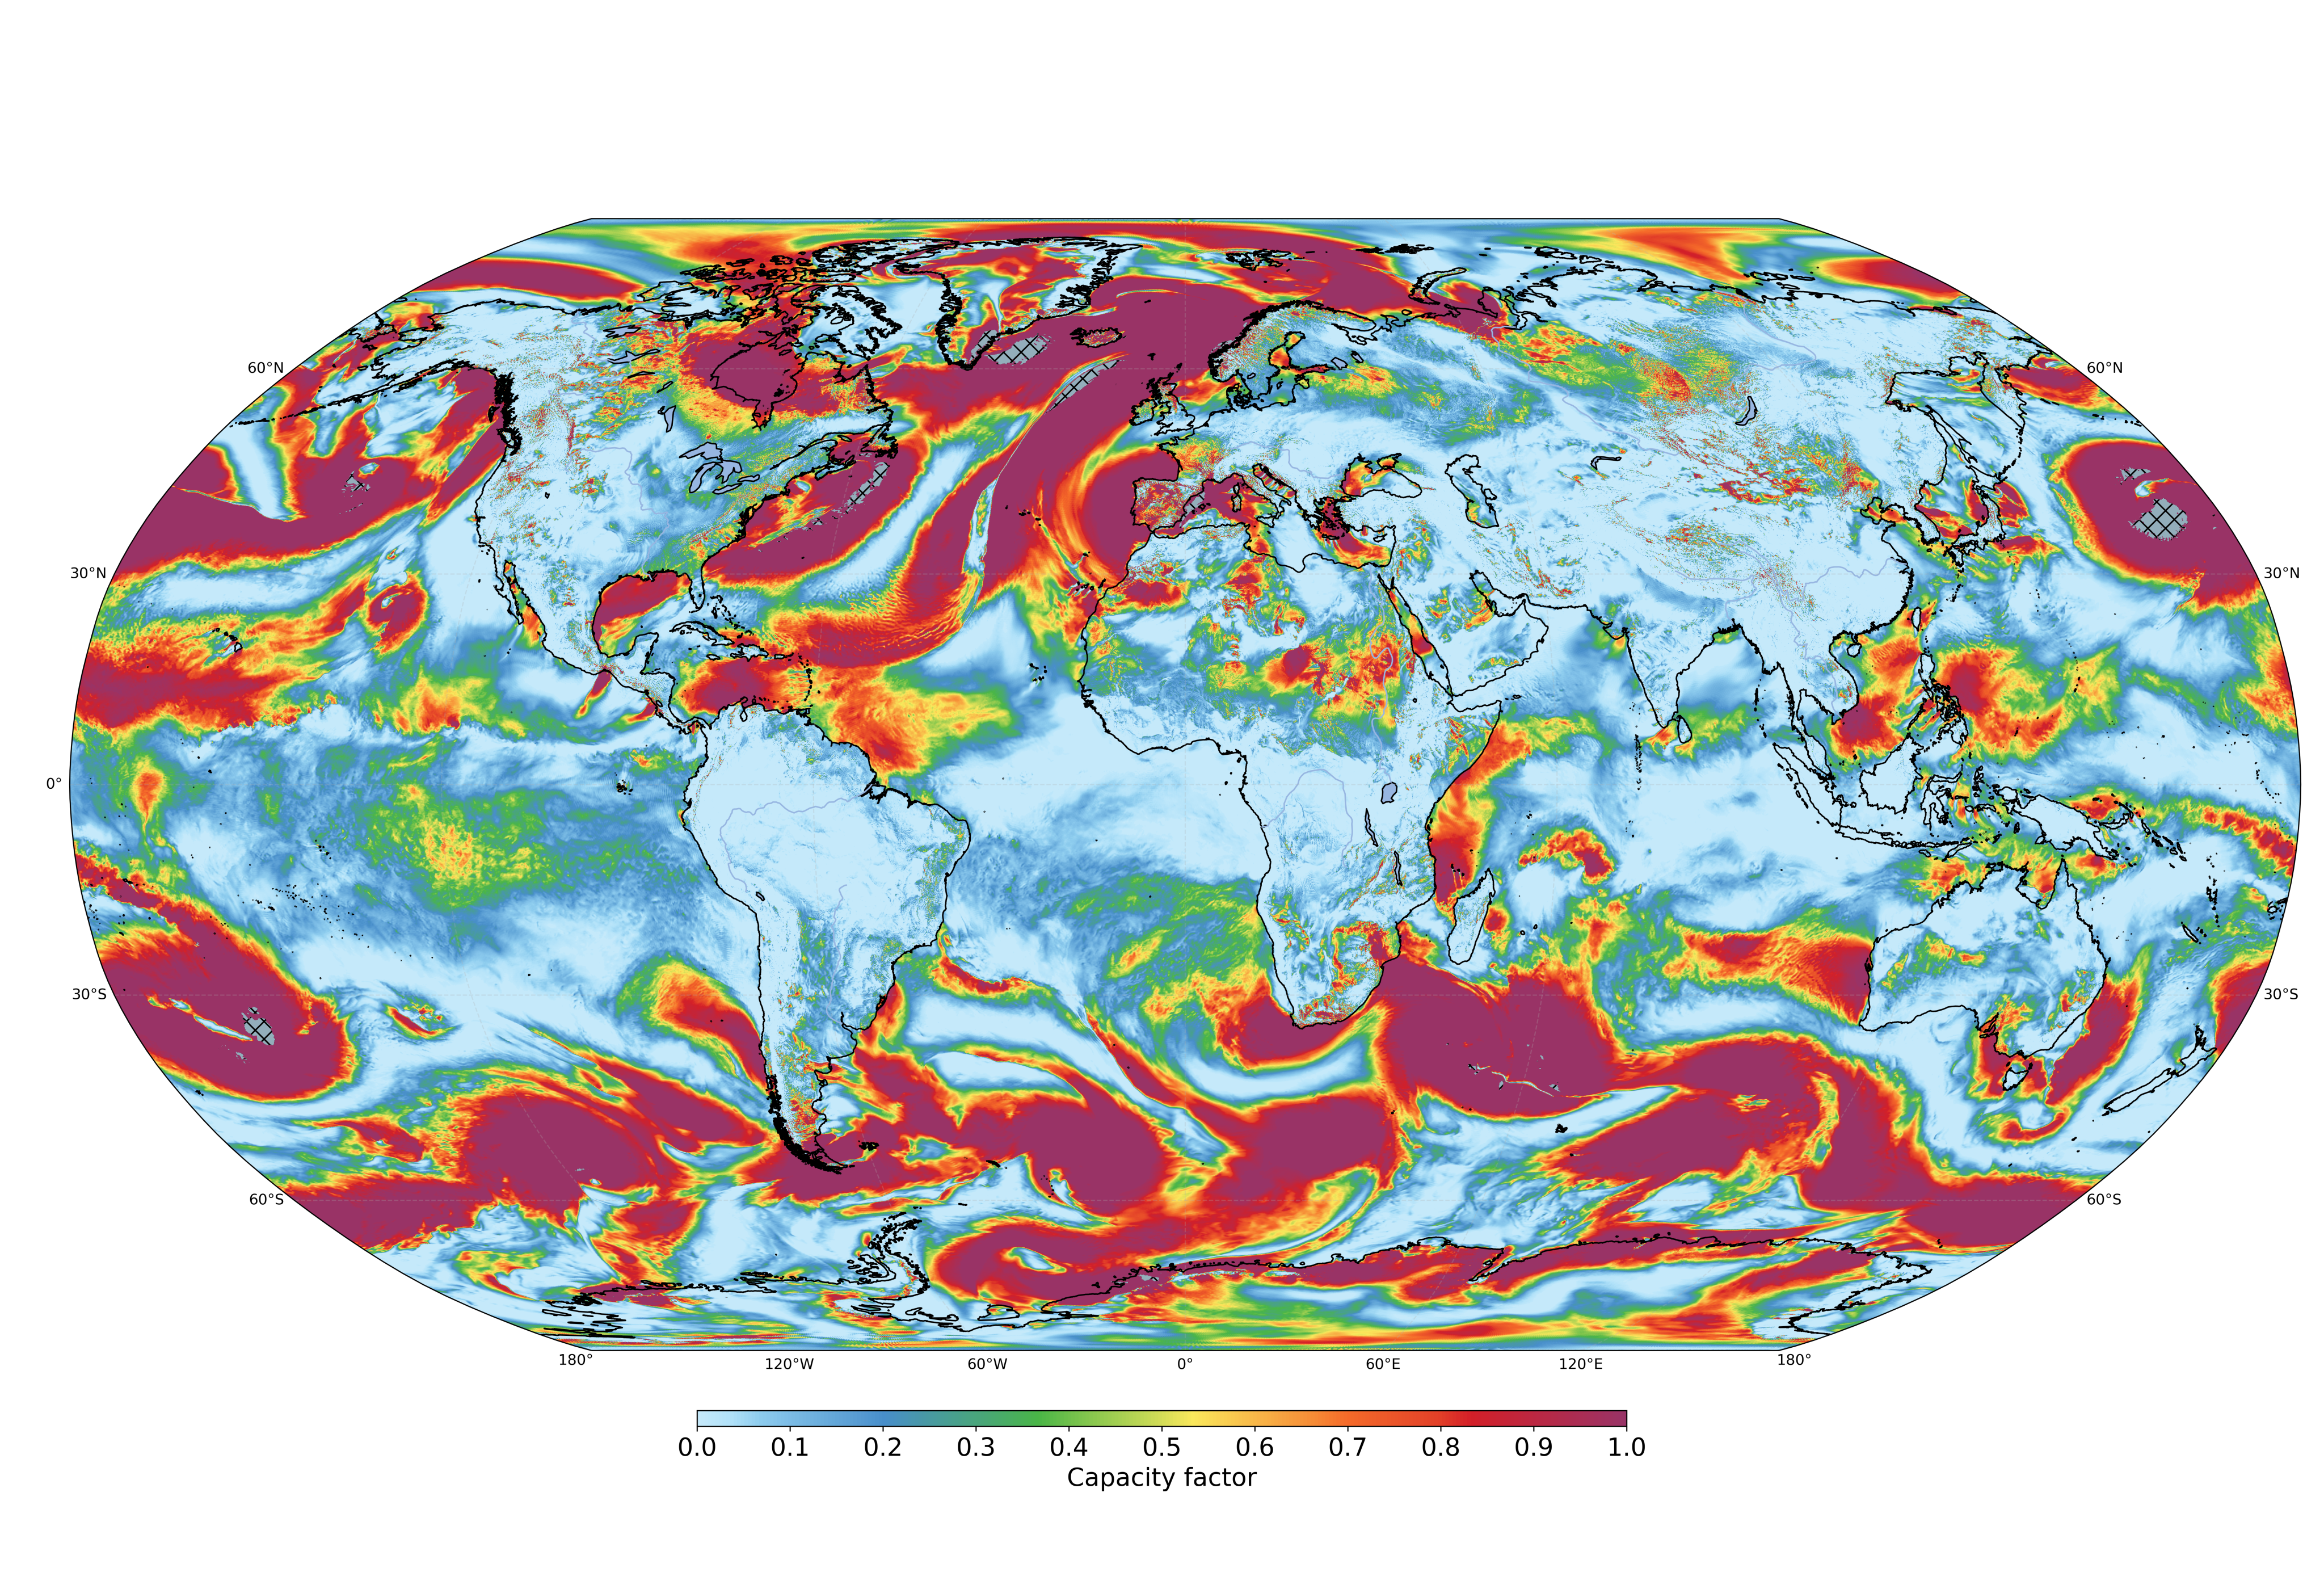
Global map at a horizontal resolution of 5 km and 1-hourly frequency for 20/01/2020. It shows the capacity factor for a class S wind turbine (Vestas V164 - 9.5 MW). Data was obtained from the IFS-FESOM model. Credit: BSC
Global map at a horizontal resolution of 5 km and 1-hourly frequency for 20/01/2020. It shows the capacity factor for a class S wind turbine (Vestas V164 - 9.5 MW). Data was obtained from the IFS-FESOM model. Credit: BSC

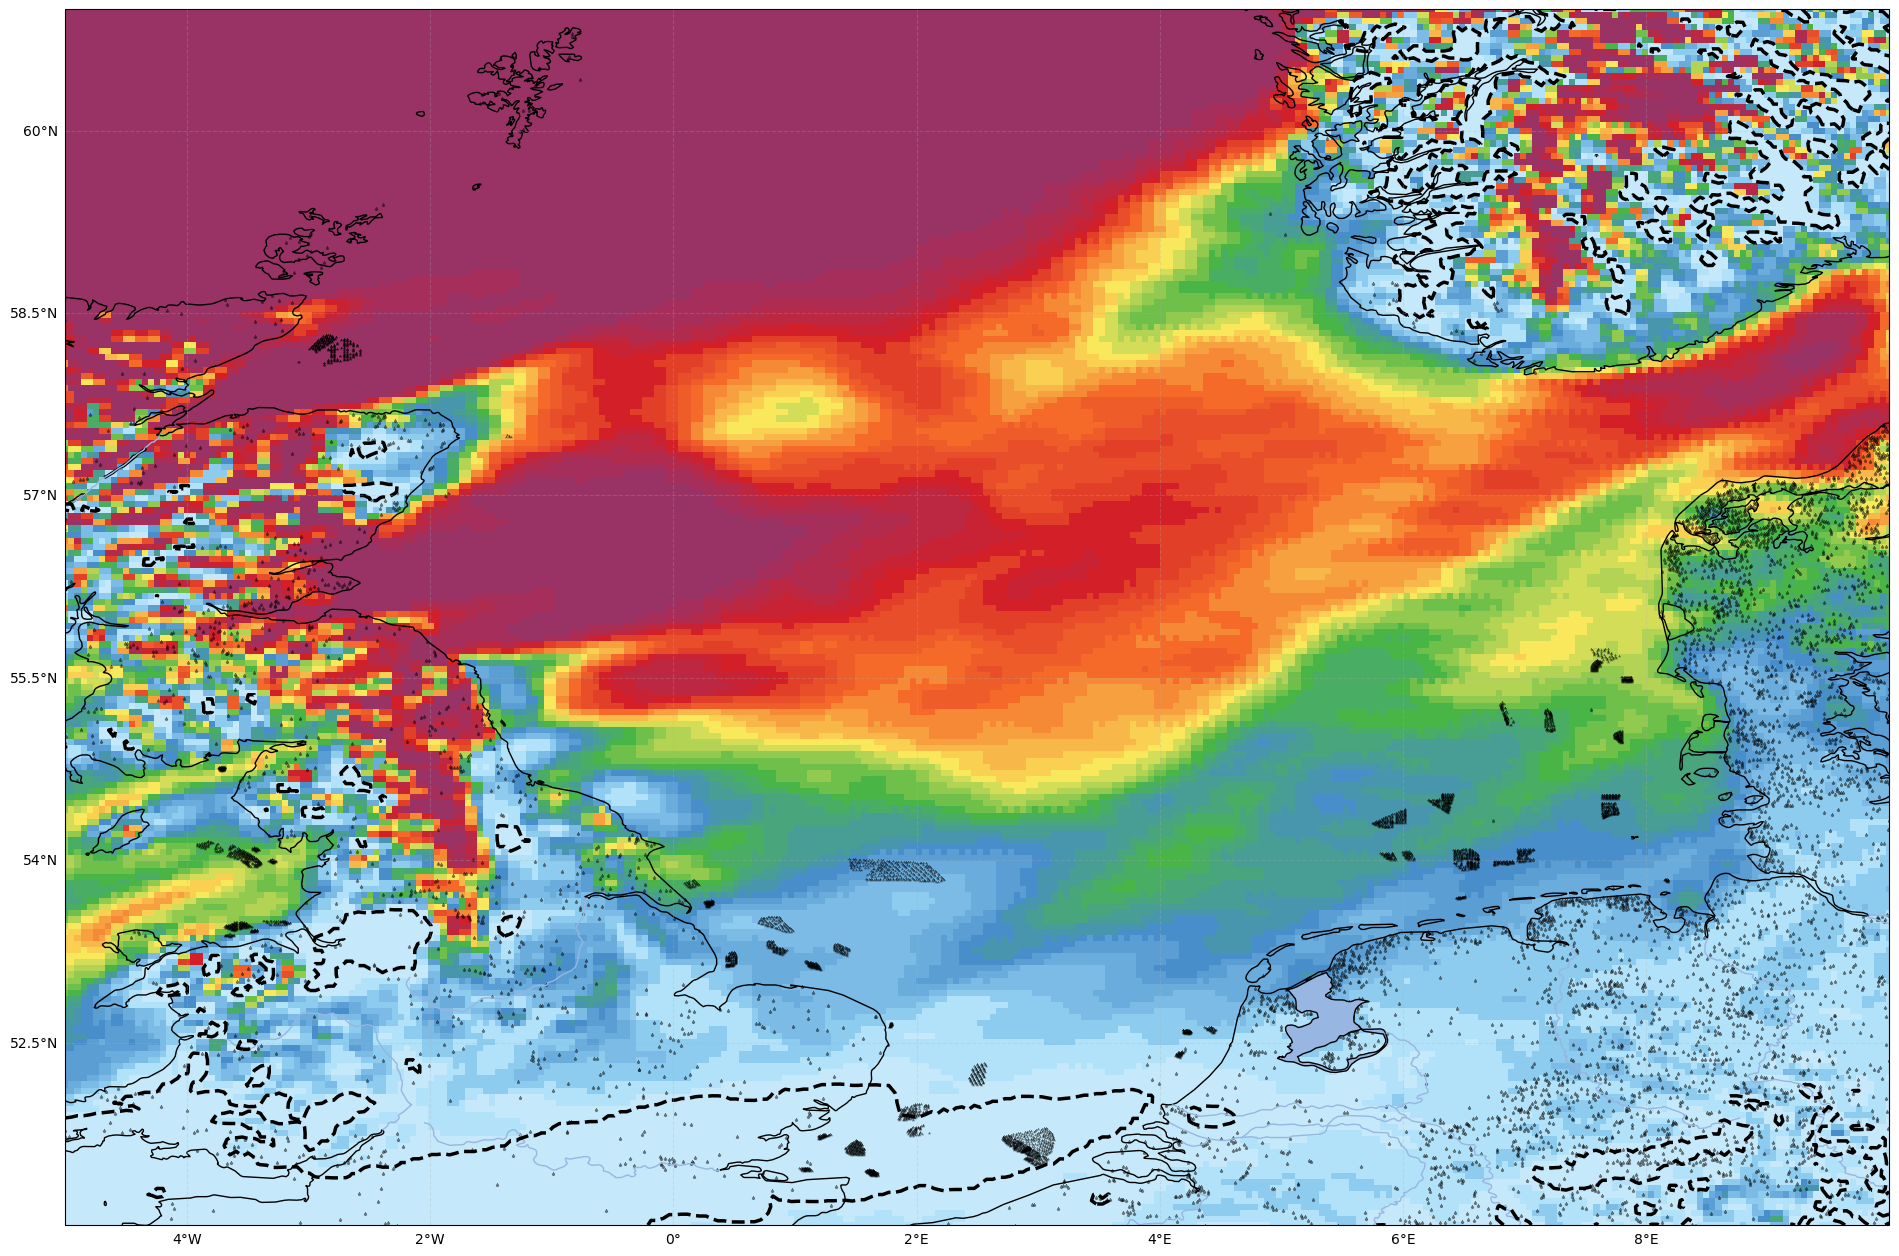
Regional map over the North Sea at a horizontal resolution of 5 km and 1-hourly frequency for 20/01/2020. It shows the capacity factor for a class S wind turbine (Vestas V164 - 9.5 MW). The black small dots over the map represent existing offshore and onshore wind farms in the region. The black dashed contour line marks where the wind is too low for the wind turbine to function. Data was obtained from the IFS-FESOM model. Credit: BSC
Regional map over the North Sea at a horizontal resolution of 5 km and 1-hourly frequency for 20/01/2020. It shows the capacity factor for a class S wind turbine (Vestas V164 - 9.5 MW). The black small dots over the map represent existing offshore and onshore wind farms in the region. The black dashed contour line marks where the wind is too low for the wind turbine to function. Data was obtained from the IFS-FESOM model. Credit: BSC
The Energy Onshore, and Energy Offshore applications are being developed in parallel providing information on key global indicators relevant to the wind farm industry at various temporal and spatial scales. Both applications will be able to work independently but share parts of the code and several functionalities.
The Onshore application focuses on energy-related indicators, such as wind speed anomalies, power density, capacity factors, annual energy production and the interannual variability of these metrics, among others.
The Offshore application will produce specific estimates of relevant parameters for offshore wind farms in areas subject to seasonal ice, such as icing due to sea spray, and others relevant to the construction and maintenance, including sea ice, ice-related stress to the structures and expected navigability.
The applications will provide estimates of future wind turbine resources and wind turbine vulnerability, including 10-minute wind speed distribution with its changes at the multi-decadal scale to help improve wind farm design. Another key aspect of the application will be to evaluate how electricity demand will change in future climate scenarios.
Hydrology - Simulating the future of extreme events
The HydroMet application will provide statistics of hydrological extremes and estimates of the possible changes induced by climate change in future extreme events. This will be made possible by identifying extreme rainfall events in the Climate DT data stream, that ultimately will be summarised in an event catalogue.
The use case will provide information about, for example, the spatial and temporal extent of an event, precipitation amounts and return time, the frequency of an extreme event in a particular area.
The application is based on two different codes developed by the German Meterological Service Deutsche Wetterdienst (DWD), that has done considerable efforts to anticipate excess rain since several decades.
- KOSTRA2020 is the latest version of KOSTRA-DWD, a coordinated effort across Federal states to develop methods for extreme evaluation. The system, developed through three decades, provides data about precipitation levels, duration and the annual return interval.
- CatRaRE or Catalogue of Radar-based heavy Rainfall Events, is a software package able to detect and define extreme rain events and at the same time generate a catalogue with meteorological and geographical information for each event.

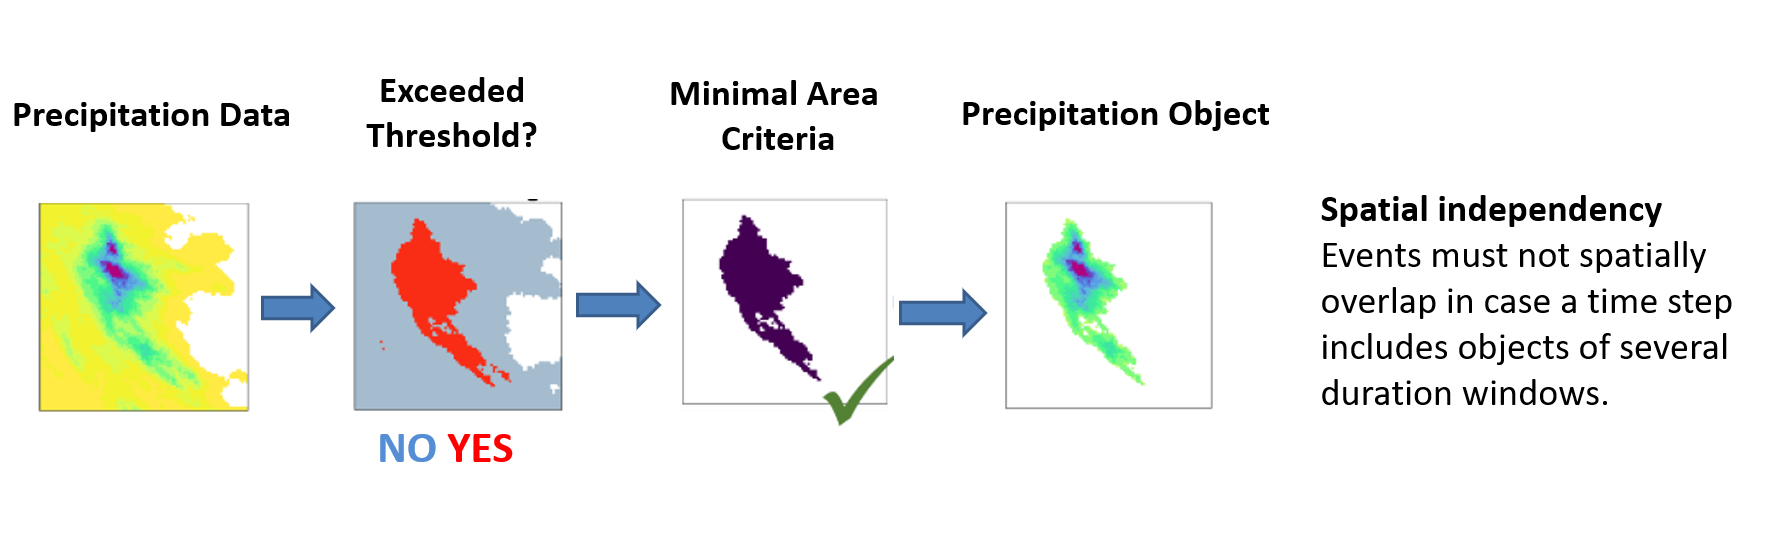
Schematic overview of the two criteria that define single events. Spatial independency
Schematic overview of the two criteria that define single events. Spatial independency

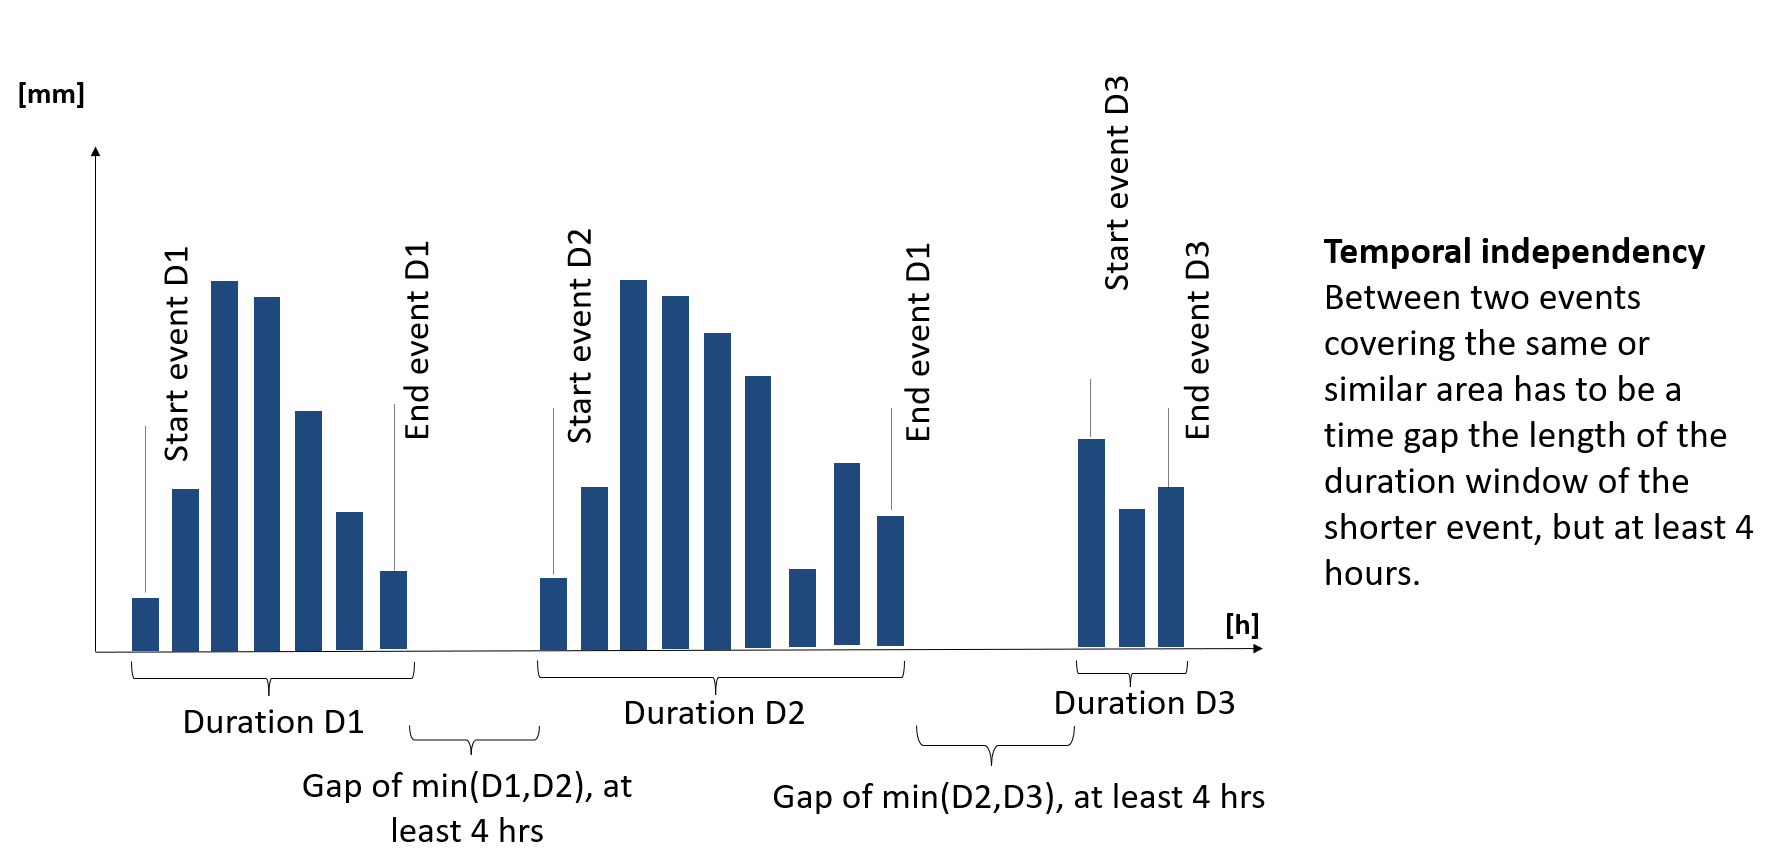
Schematic overview of the two criteria that define single events. Temporal independency
Schematic overview of the two criteria that define single events. Temporal independency
With these powerful tools as a starting point, the use case will adapt the software to extract the relevant information from the high-resolution Climate DT data stream, generating a catalogue of simulated extreme events that will extract information about the size, duration, intensity and other variables of these simulated flash floods or extreme precipitation events.
Therefore, the application will allow users to obtain large amounts of homogenous information about past, present and future extreme rainfall events at the local-to-regional scales where the impacts are felt and the adaptation decisions are taken.
DAS-Basisdienst “Klima und Wasser”, the German operational coordination framework for adaptation strategies on Climate and Water is the main user identified.
Urban heat stress - More resilient city planning
With this use case the capabilities of the Climate DT will be used to address the pressing issue of heat stress in urban areas, where 75% of the European population currently lives. Heatwaves are possibly the extreme weather event with the biggest and most direct impacts on human wellbeing, and with climate change are predicted to be more severe and frequent and longer.
The heat island effect multiplies the consequences of extreme temperatures and with the better simulations of the global circulation systems included in the Climate DT we can improve our understanding of the expected evolution of heat islands under climate change conditions, to apply more effective adaptation measures.

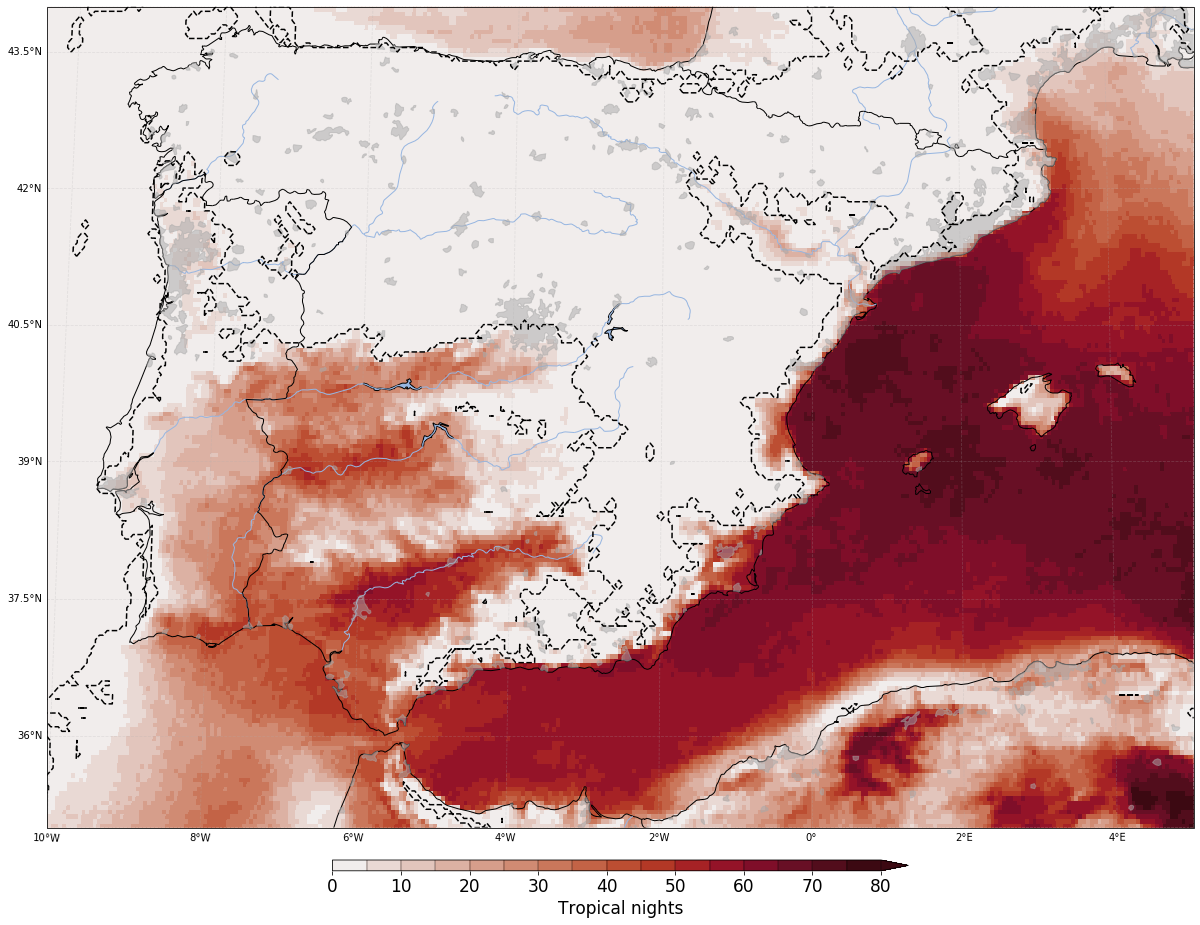
Number of tropical nights for JJA (June-July-August) in 2020 over the Iberian Peninsula at a horizontal resolution of 5 km. Data comes from the ICON model. Grey shaded areas represent urban regions. The black dashed contour line marks the limit between regions with tropical nights and regions with no tropical nights in this period. Credit: BSC
Number of tropical nights for JJA (June-July-August) in 2020 over the Iberian Peninsula at a horizontal resolution of 5 km. Data comes from the ICON model. Grey shaded areas represent urban regions. The black dashed contour line marks the limit between regions with tropical nights and regions with no tropical nights in this period. Credit: BSC

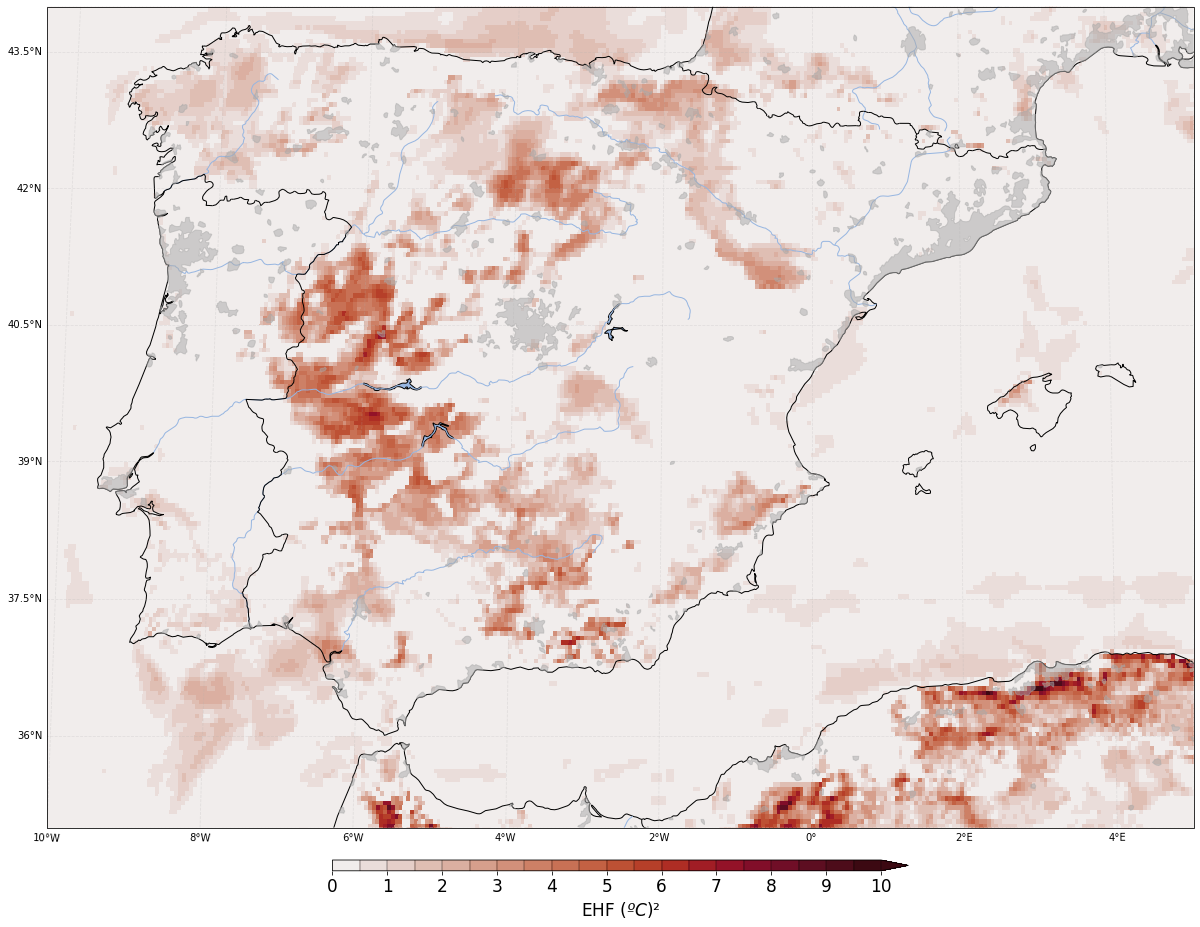
Excess Heat Factor (an indicator that measures heatwave intensity) for JJA (June-July-August) in 2020 over the Iberian Peninsula at a horizontal resolution of 5 km. Data comes from the ICON model. Grey shaded areas represent urban regions. Credit: BSC
Excess Heat Factor (an indicator that measures heatwave intensity) for JJA (June-July-August) in 2020 over the Iberian Peninsula at a horizontal resolution of 5 km. Data comes from the ICON model. Grey shaded areas represent urban regions. Credit: BSC
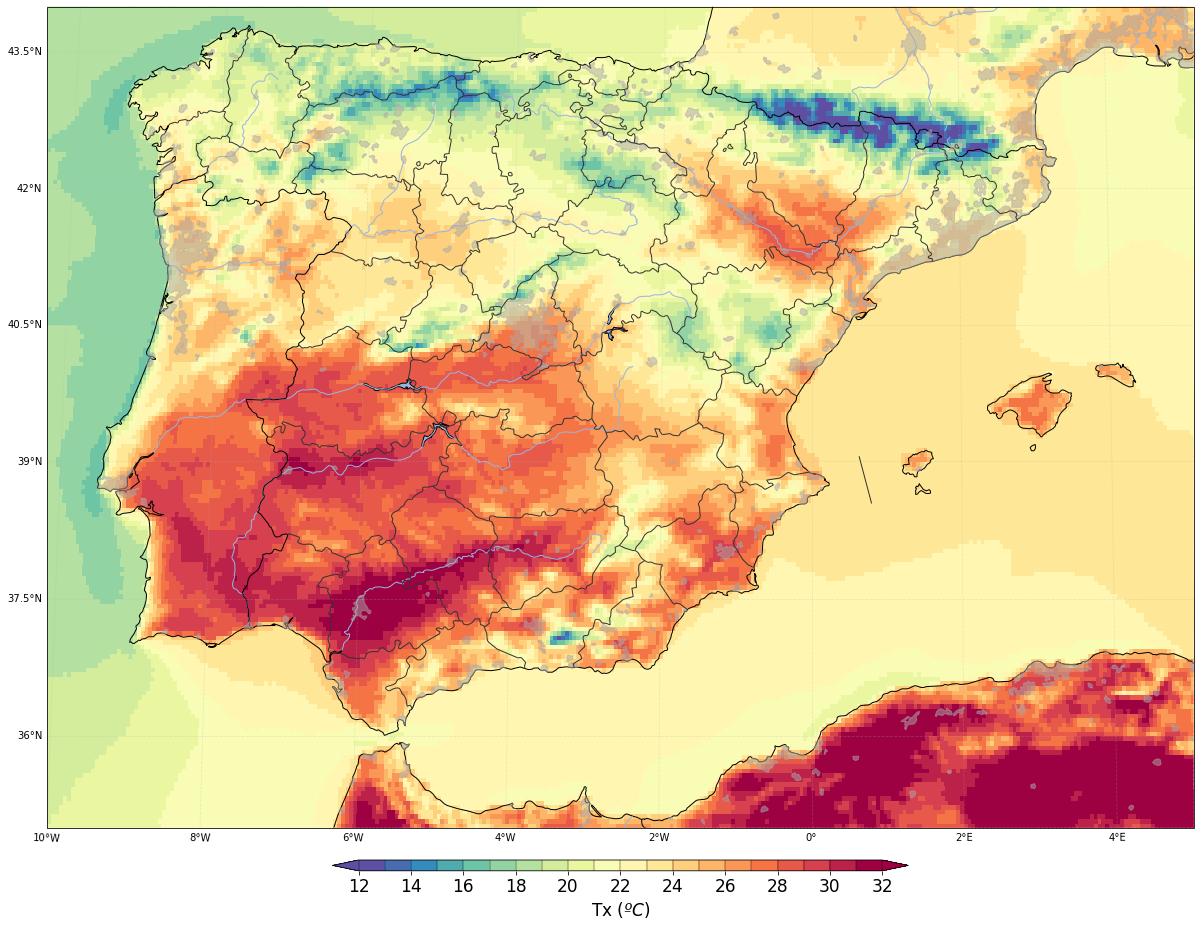
This figure shows average maximum temperature (Tx) for JJA (June-July-August) in 2020 over the Iberian Peninsula at a horizontal resolution of 5 km. The average was computed using daily temperature values. Data comes from the ICON model. Grey shaded areas represent urban regions. Credit: BSC
This figure shows average maximum temperature (Tx) for JJA (June-July-August) in 2020 over the Iberian Peninsula at a horizontal resolution of 5 km. The average was computed using daily temperature values. Data comes from the ICON model. Grey shaded areas represent urban regions. Credit: BSC
Through this use case the Climate DT will provide a heat stress index obtained from several indicators as well as from existing specific heat stress indicators, commuted using the Thermofeel library, developed by ECMWF. The application will be coupled with a machine learning downscaling model developed by Portugal’s +ATLANTIC.
The application will produce a set of temperature extreme indicators such as tropical nights, warm nights, summer days, warm days, absolute maximum temperature, excess heat factor and heat wave magnitude index, to name a few, and thermal comfort indicators like cooling degree days, NOAA Heat Index, wet bulb globe temperature and Universal Thermal Climate Index, at several spatial and temporal scales.
Initially the use case will be demonstrated for selected cities across the 5 continents. Thanks to the +ATLANTIC machine learning processing, the Urban application will downscale the information about heat island effect at around 100-200m spatial resolution.
In the long term the vision for the Urban use case is to allow urban planners (architects, civil engineers, decision makers...) to interact with the simulations for a better understanding of the best adaptation practices against extreme temperatures in urban environments.
Destination Earth is a European Union funded initiative launched in 2022, with the aim to build a digital replica of the Earth system by 2030. The initiative is being jointly implemented by three entrusted entities: the European Centre for Medium-Range Weather Forecasts (ECMWF) responsible for the creation of the first two ‘digital twins’ and the ‘Digital Twin Engine’, the European Space Agency (ESA) responsible for building the ‘Core Service Platform’, and the European Organisation for the Exploitation of Meteorological Satellites (EUMETSAT), responsible for the creation of the ‘Data Lake’.
We acknowledge the EuroHPC Joint Undertaking for awarding this project strategic access to the EuroHPC supercomputers LUMI, hosted by CSC (Finland) and the LUMI consortium, Marenostrum5, hosted by BSC (Spain) Leonardo, hosted by Cineca (Italy) and MeluXina, hosted by LuxProvide (Luxembourg) through a EuroHPC Special Access call.
More information about Destination Earth is on the Destination Earth website and the EU Commission website.
For more information about ECMWF’s role visit ecmwf.int/DestinE
For any questions related to the role of ECMWF in Destination Earth, please use the following email links: