
Monitoring harmful UV rays and the ozone layer

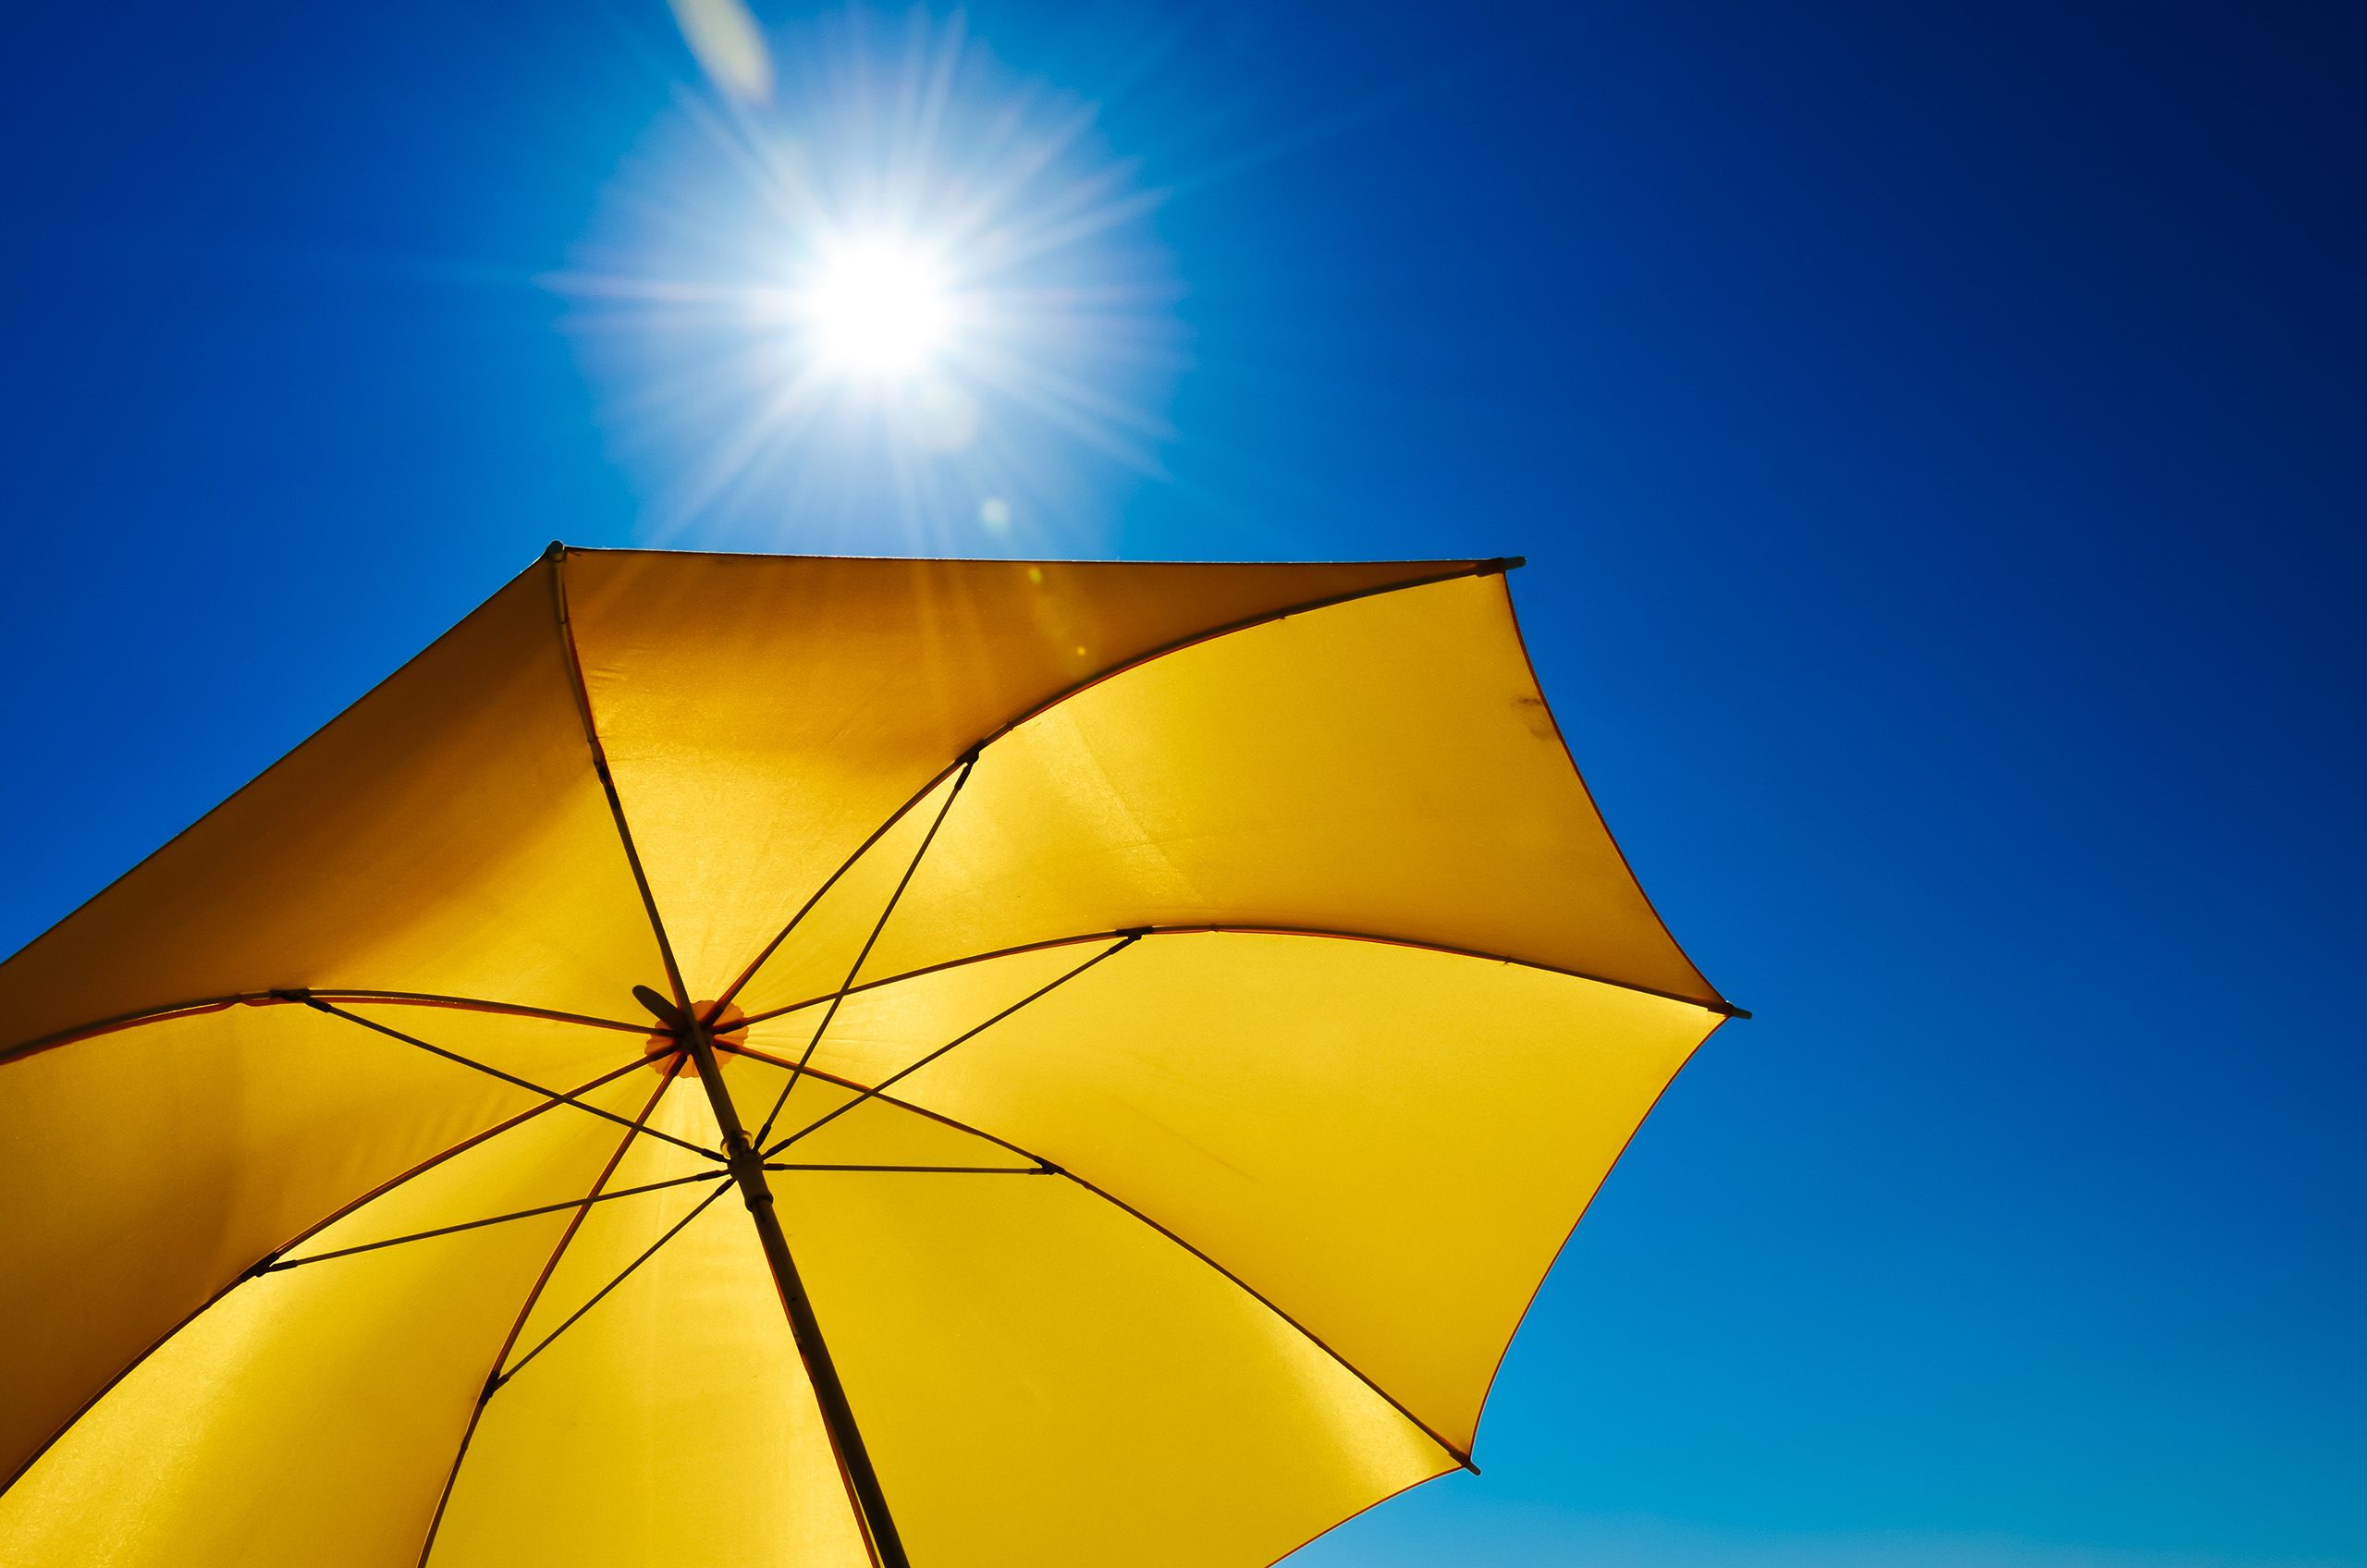
Australia is famous for its sunny weather. Some regions and cities like Sydney experience sunny days for most of the year. But underlying this is a worrying trend: Australia has one of the highest skin cancer rates in the world. Statistics suggest that two in three Australians are diagnosed with skin cancer by the age of 70. The main cause of this is the extended exposure of the Australian population to high levels of ultraviolet (UV) radiation, a harmful form of radiant energy from the Sun.
The likelihood of getting skin cancer is dramatically cut by increasing protection to UV rays and reducing the amount of time spent in direct sunlight. To this end, skin cancer prevention programme SunSmart has been helping Australians realise the dangers of UV exposure since it was established in 1988. A key application offered by SunSmart is a free mobile application that warns users about UV exposure, using data sourced from the Copernicus Atmosphere Monitoring Service (CAMS). The Australian Bureau of Meteorology (the bureau) feeds the quality-assured CAMS UV index forecasts straight into SunSmart, so the application’s UV exposure forecasts are updated each day. Australians easily access this data in the application, to plan their work and leisure activities so that they avoid the harmful effects of UV exposure and save their skin.
Changing perceptions
on weather and UV forecasts
UV radiation is the main cause of skin cancer. A common misconception is that it is the Sun’s light (visible radiation) and heat (infrared radiation) that burn skin and cause cancer; so many people check the weather forecast rather than the UV forecast to assess their levels of risk of sunburn. But UV radiation is invisible and cannot be felt. UV levels can be damagingly high even on cloudy, cool days.


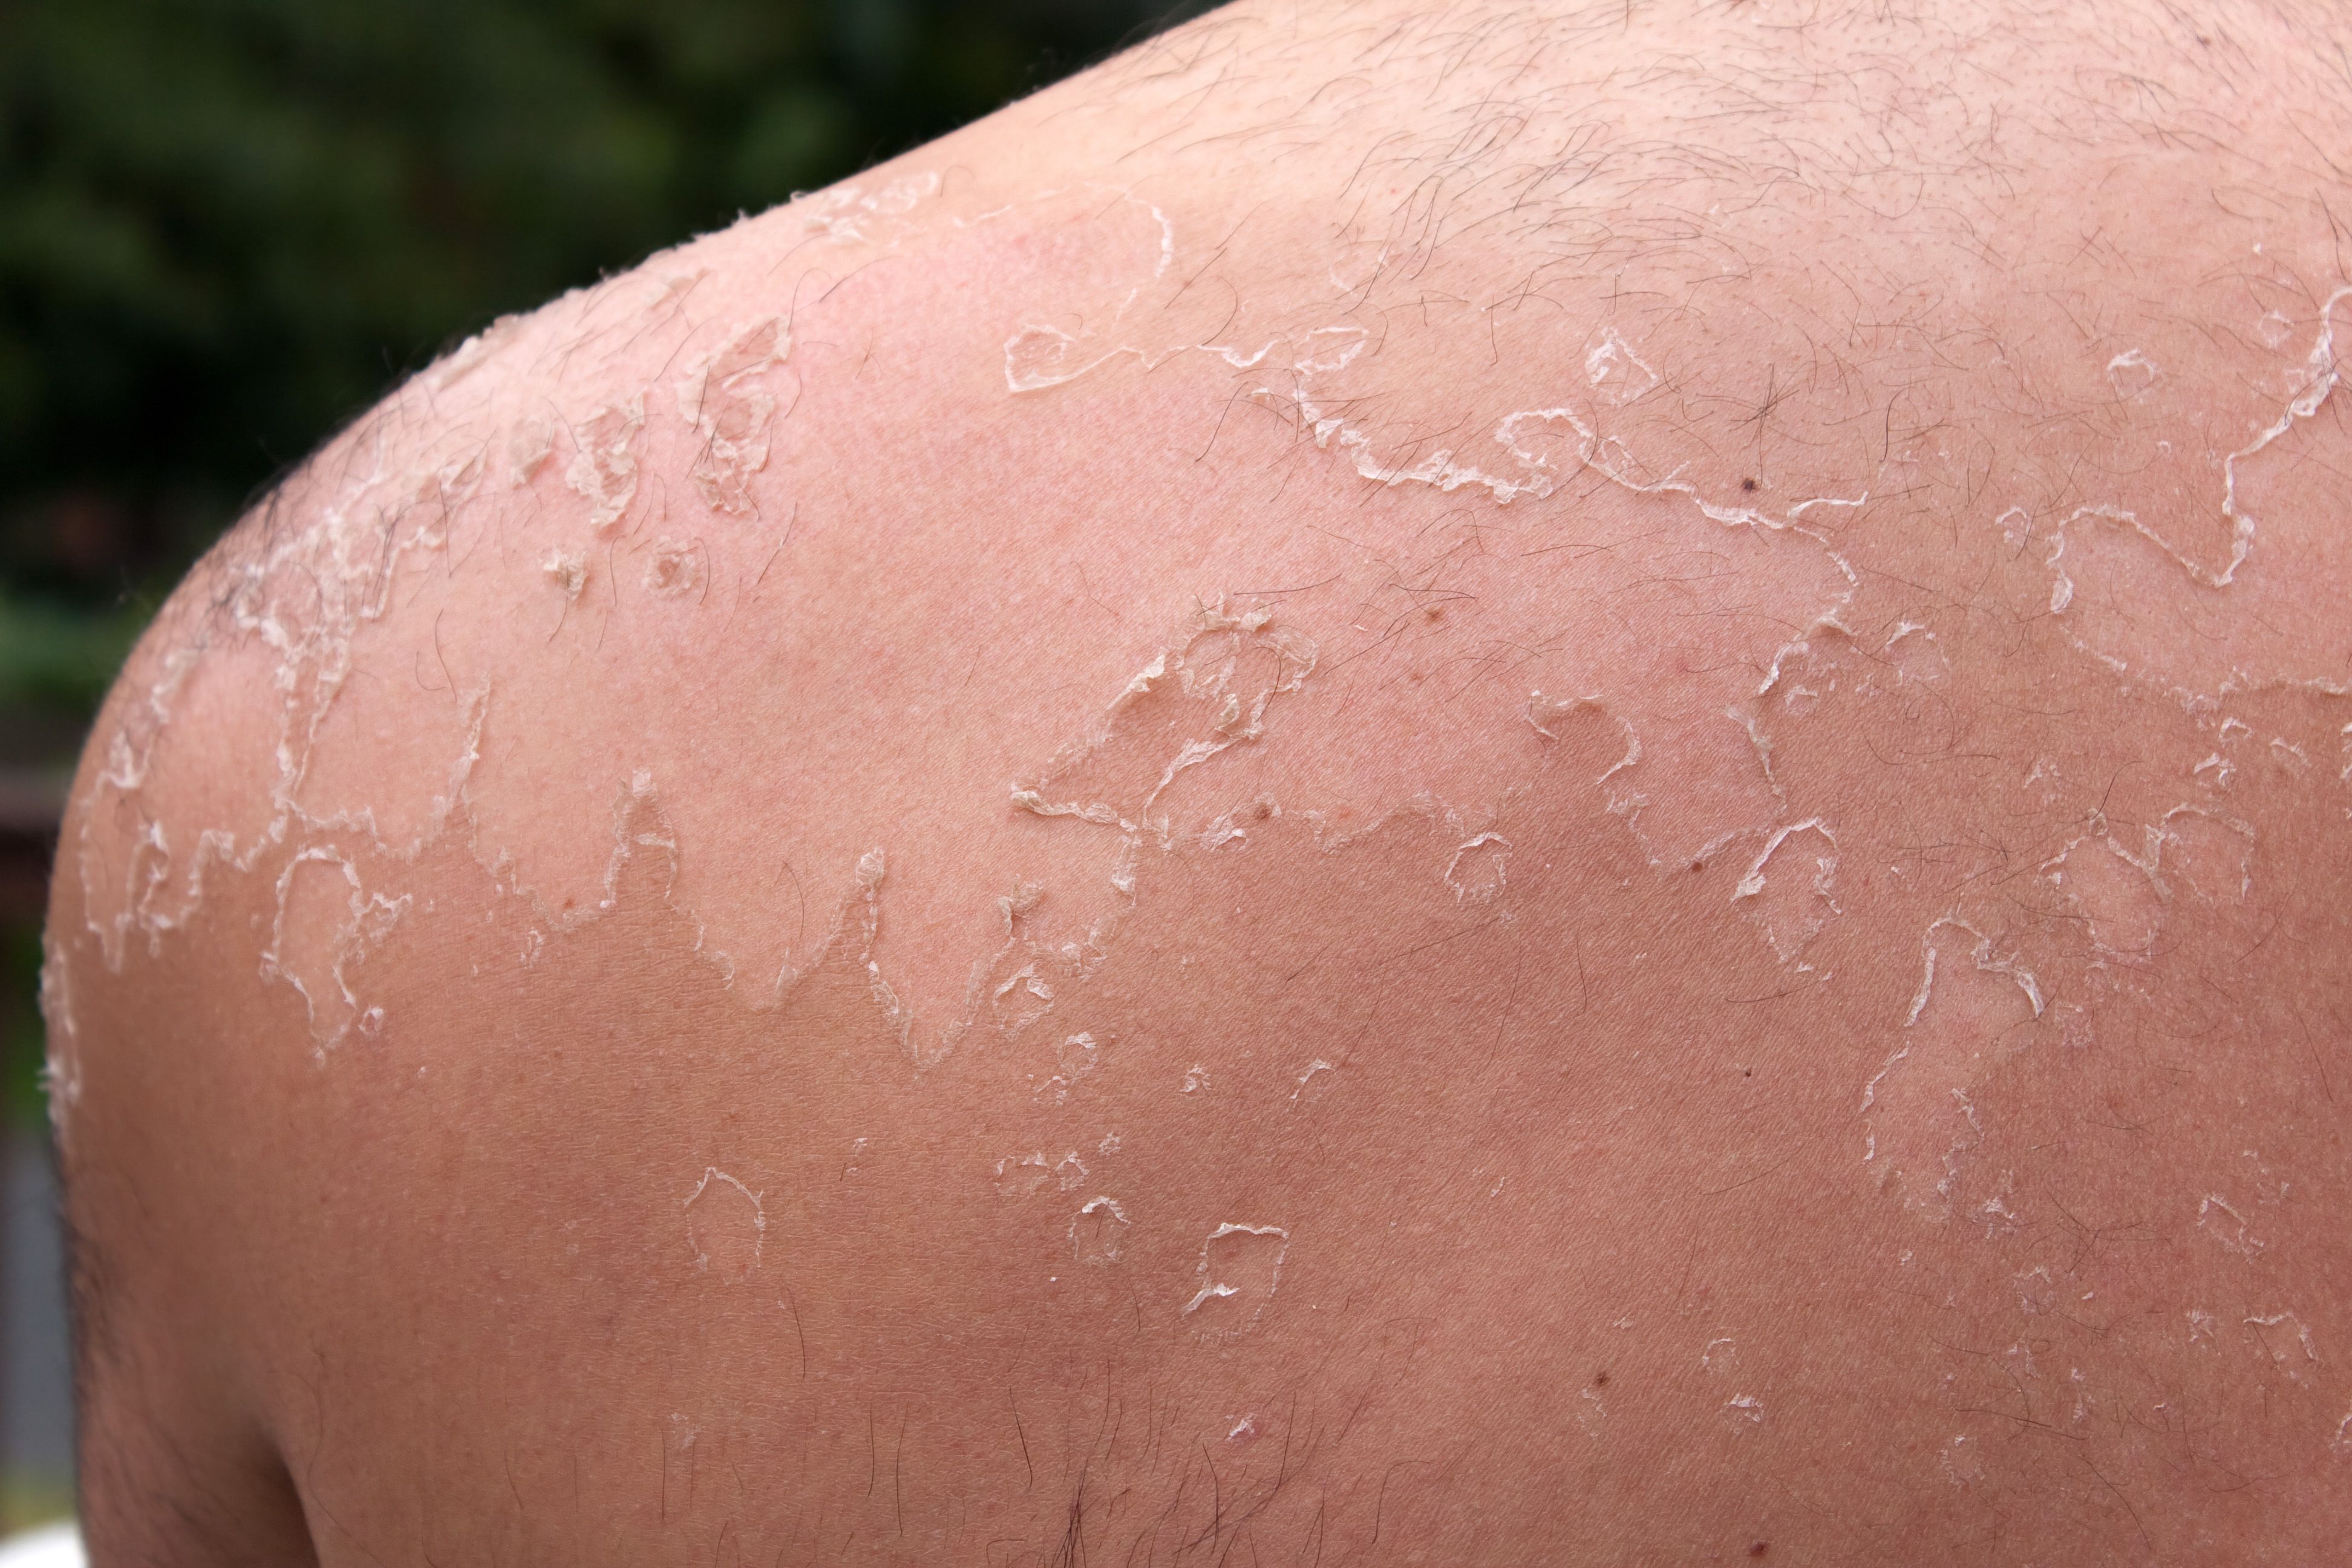
Overexposure to UV radiation can lead to a range of health problems in humans, from skin damage to skin cancer. UV also harms the eyes, causing cataracts, inflammation of the conjunctiva and cornea, and damage to the retina.
People often do not realise that damage has been done to their skin until it has already happened. UV exposure is also cumulative, increasing the chances of serious skin problems incrementally. The greater the UV exposure, the greater the long-term risk.
UV levels are affected by many factors, including the status of the ozone layer, the time of day, cloud cover, aerosol particles in the air, and geographic positioning. Australia is particularly at risk because it has many days without cloud cover and the Earth is slightly closer to the Sun during the Southern Hemisphere summer compared to the Northern Hemisphere summer. These are factors that contribute to the country’s high UV rates.


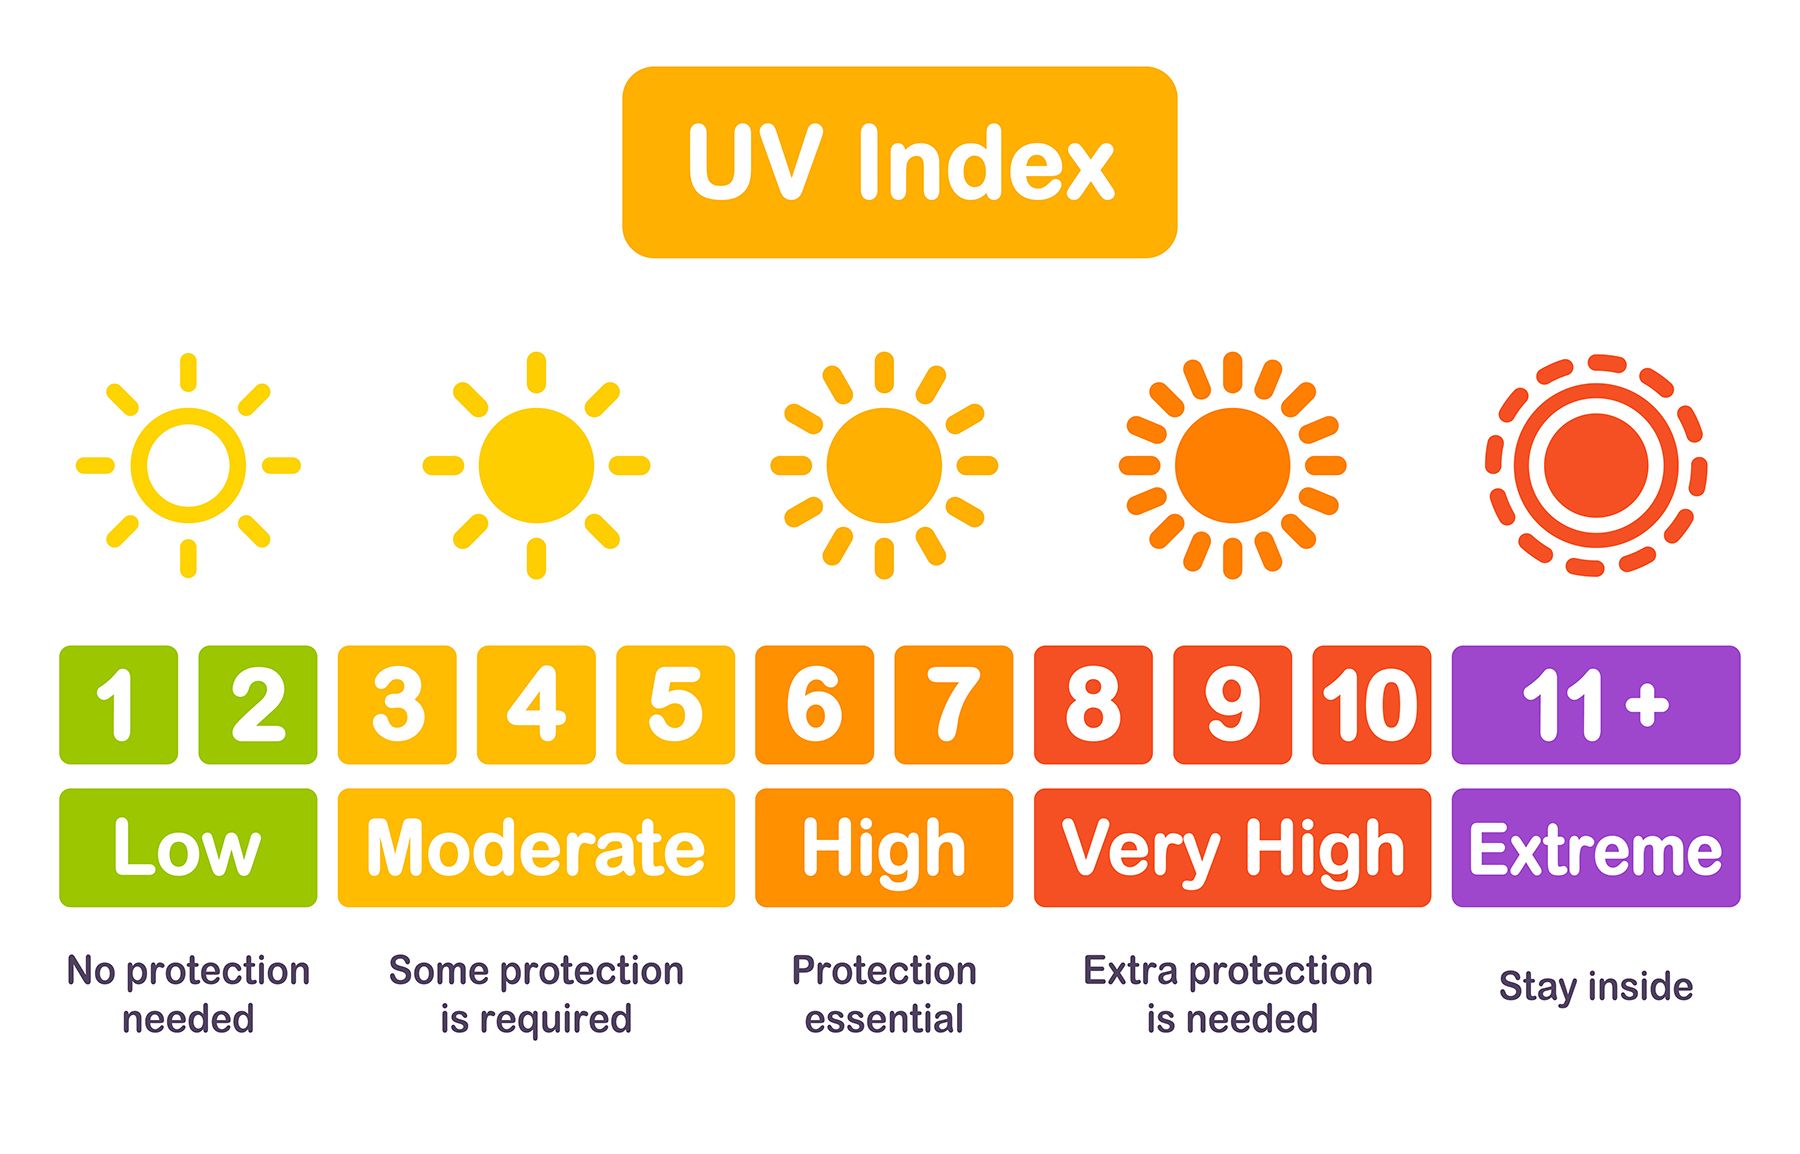
The UV index is an international measurement based on the strength of the Sun.
The World Health Organization recommends applying skin protection when levels are above 3. During summer in Australia, the UV index usually sits between 10 and 14.
Earth has a natural sunscreen in the atmosphere: a layer of ozone gas in the stratosphere, enveloping the planet. It acts like a shield, preventing much of the Sun’s harmful UV radiation from reaching Earth’s surface.
Ozone is also found in other parts of the atmosphere, for instance in the troposphere, where it is a pollutant at ground level that can cause respiratory problems, especially as part of summer smog. Tropospheric ozone also acts as a greenhouse gas, aggravating global warming. Levels of ozone in the stratosphere experience natural fluctuations, but human influence has also had a profound effect on this natural protective layer.
During the 20th century, chemicals known as chlorofluorocarbons – mainly used in aerosol spray cans, as solvents and as cooling agent in refrigerators – were produced and released into the atmosphere. These chemicals can stay in the atmosphere for a very long time. Every year, as the Southern Hemisphere heads into spring, they are broken down by sunlight and the resulting chlorine molecules destroy ozone in the very cold polar air.
This thinning leads to an ‘ozone hole’ appearing over Antarctica.

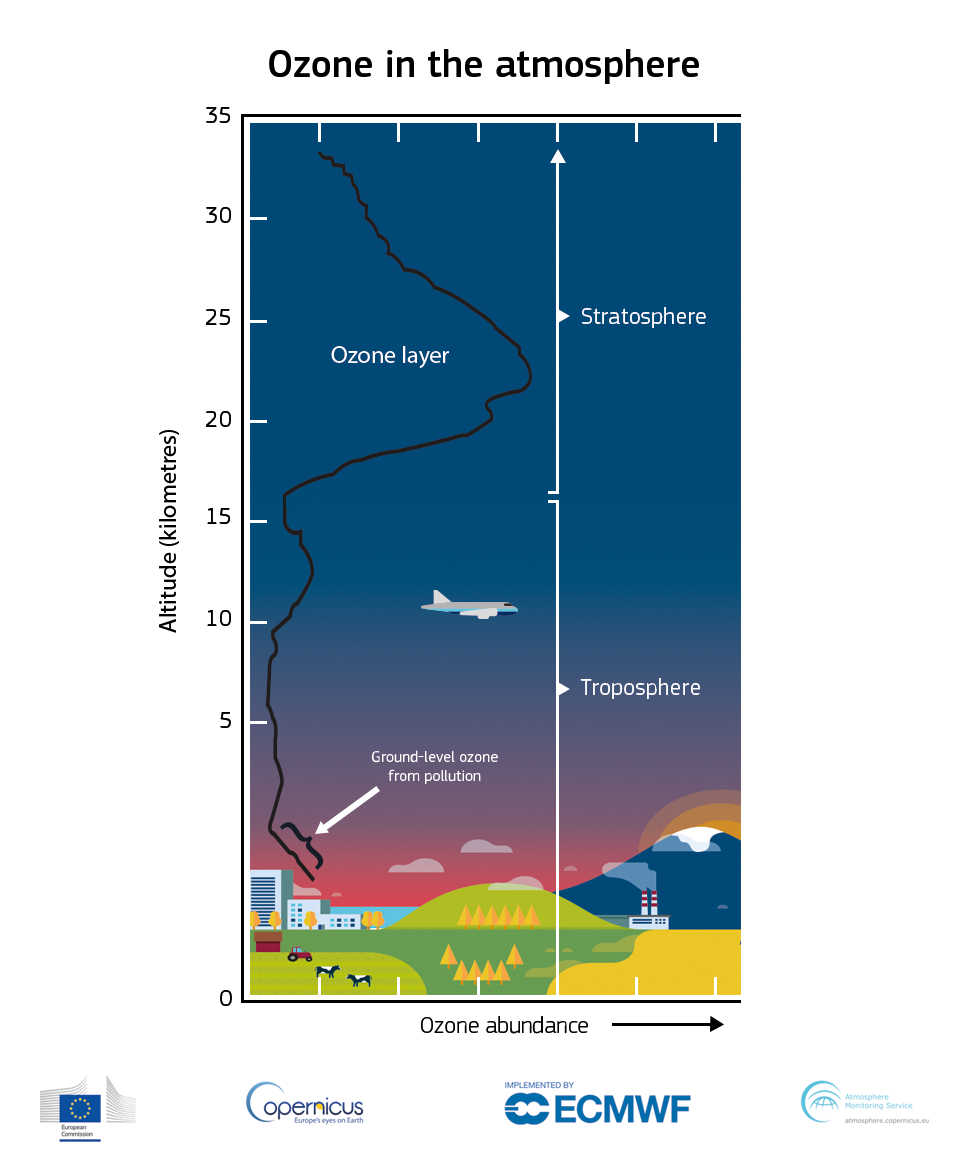
Typical vertical profile of ozone, adapted from Salawitch et al, WMO, 2019. Credit: Copernicus Atmosphere Monitoring Service, ECMWF.
Typical vertical profile of ozone, adapted from Salawitch et al, WMO, 2019. Credit: Copernicus Atmosphere Monitoring Service, ECMWF.
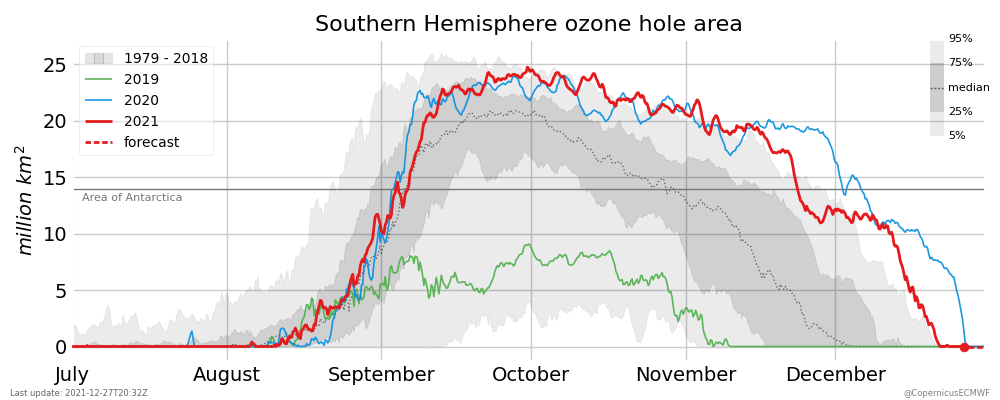
Graph showing the annual formation of the Antarctic ozone hole. The data clearly show a trend in decreasing area of the ozone hole since the ban on halocarbons, although year-to-year variations can still be significantly large. Credit: Copernicus Atmosphere Monitoring Service, ECMWF.
The Antarctic ozone hole is usually at its largest between September and November, leading to more UV radiation reaching the ground.
The size and duration of the ozone hole changes from year to year. The Copernicus Atmosphere Monitoring Service (CAMS) monitors levels of stratospheric ozone and assesses the extent of the ozone hole.
In 1987, countries around the world came together to sign the Montreal Protocol, an international treaty designed to phase out the production of chemicals harmful to the ozone layer. As a result of the treaty and subsequent amendments, the ozone layer appears to be slowly recovering.

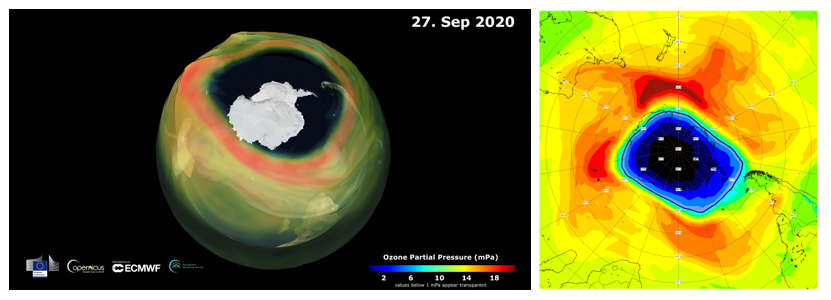
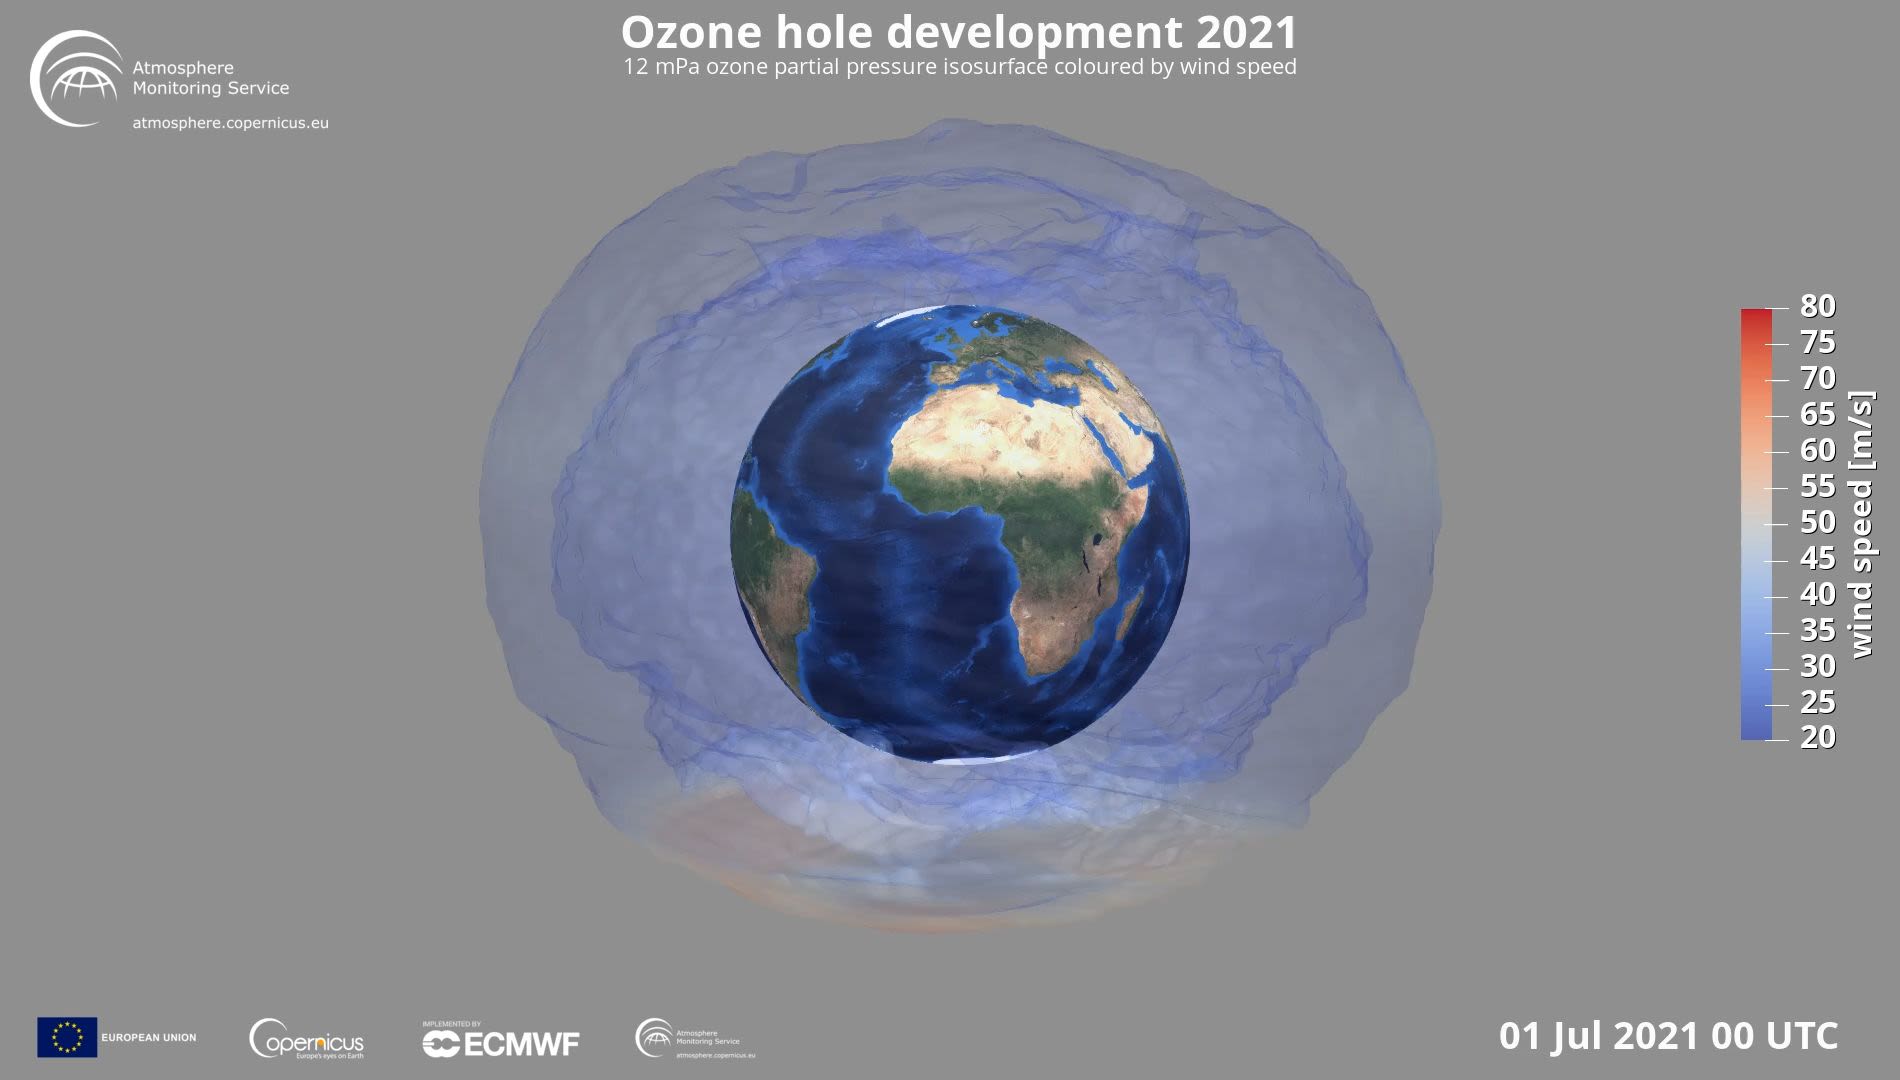
CAMS monitors the global 3D distribution of ozone in the atmosphere all year round and tracks the formation and development of the ozone hole. Credit. Copernicus Atmosphere Monitoring Service, ECMWF.
CAMS monitors the global 3D distribution of ozone in the atmosphere all year round and tracks the formation and development of the ozone hole. Credit. Copernicus Atmosphere Monitoring Service, ECMWF.
Ozone monitoring
Ozone at all levels is monitored constantly by CAMS: data from satellites in orbit around Earth are assimilated by CAMS and validated with ground and balloon measurements.
This map is centred on the Antarctic region. Areas coloured yellow, orange and red depict high ozone values, whereas green and blue areas show low values. The solid black line is the 220 DU contour, which is commonly used to define the area of the ozone hole.
Link to ozone forecast
UV index forecast
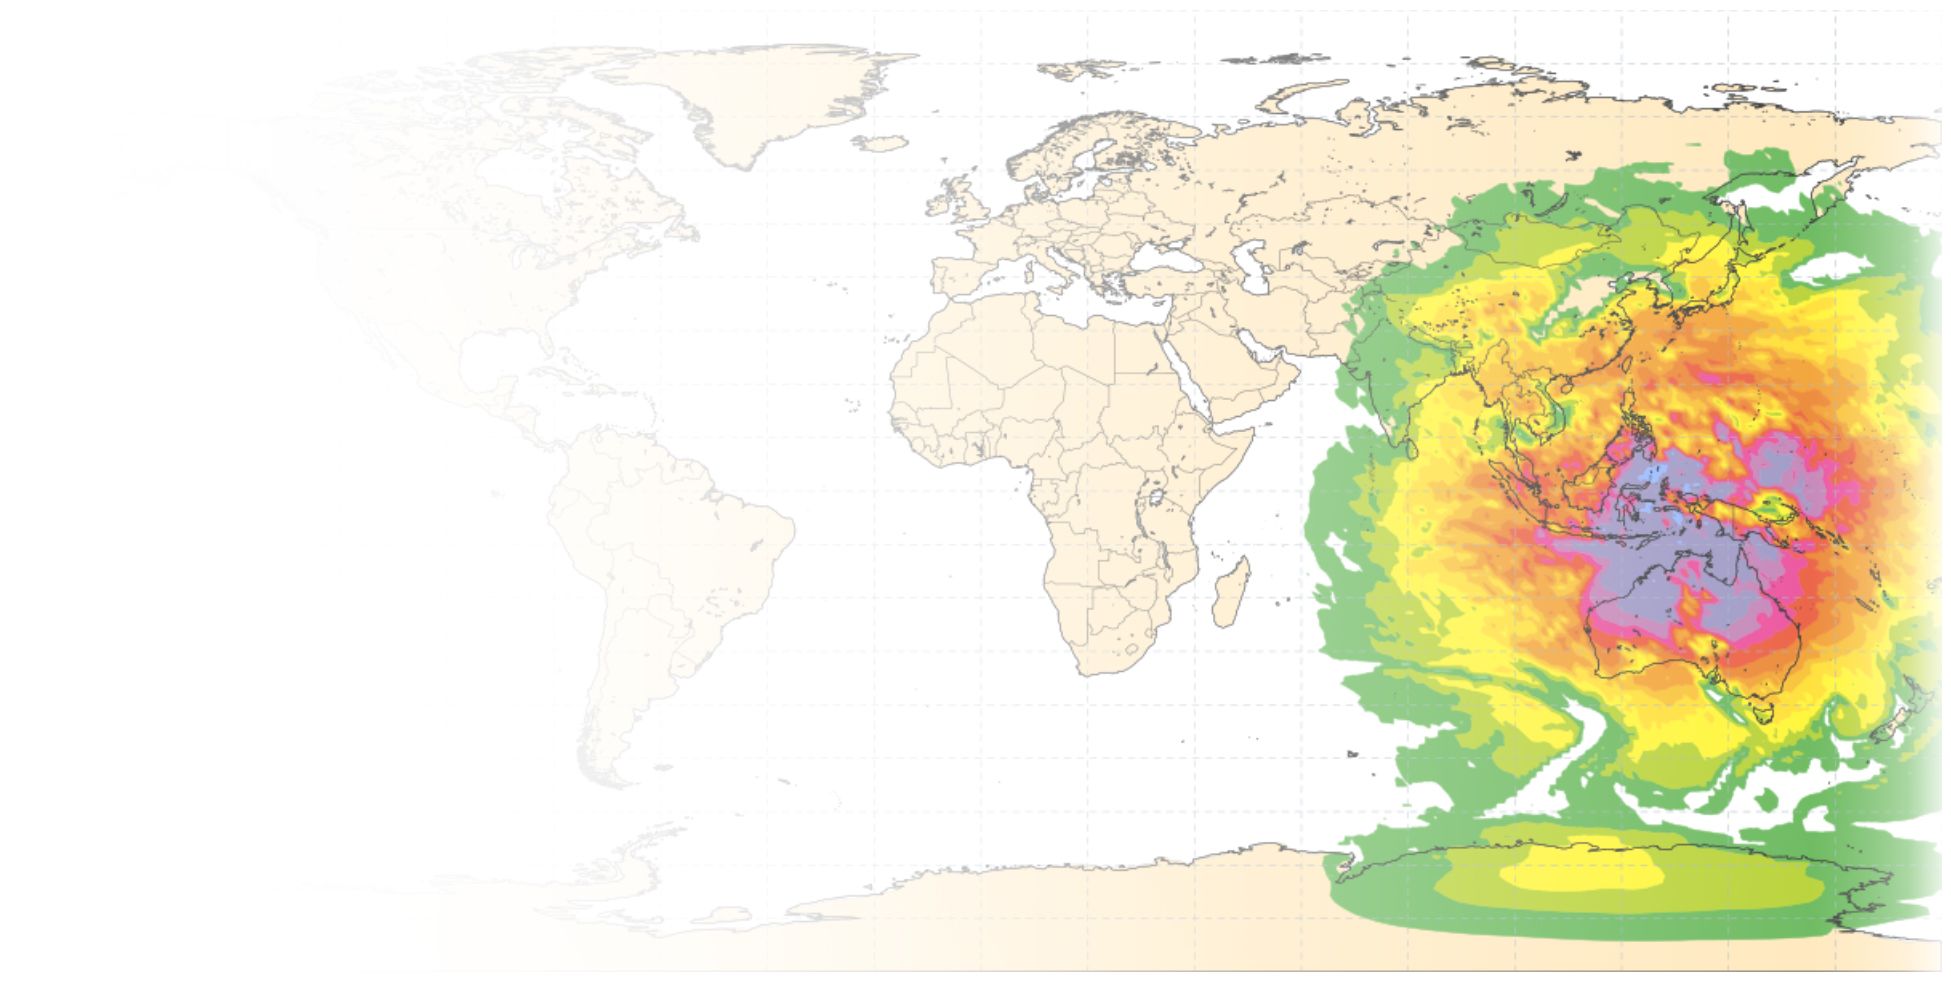
CAMS also monitors and provides forecasts of the UV index. These are based on stratospheric ozone levels, as well as cloud cover and aerosol particles in the atmosphere.
The UV index forecast predicts levels of UV radiation up to five days in advance. This information is useful to plan for protection and has been used in the development of applications related to Sun exposure.
Craig Sinclair - Head, Prevention Division and Director, World Health Organization Collaborative Centre for UV Radiation at Cancer Council Victoria, says: “When the bureau switched to using the CAMS UV index it was able to increase the length of the forecast period from two days to five days and increase the number of specific location-based forecasts from around 200 to over 700 each day. The routine validation and verification performed by CAMS gives a high level of confidence in the UV forecasts and the ongoing multinational support is vital in maintaining this service in the long term. For these reasons, the Australian Bureau of Meteorology has great confidence in this world-class forecast dataset.”
Total sky UV Index (dimensionless) forecast on the current day, on a range between 1 and 25.
Link to UV index forecast
SunSmart founded to explain the dangers of sun exposure
In 1988, Cancer Council Victoria and the Victorian Government in Australia established SunSmart,
a programme to educate citizens about the dangers of
UV radiation and its relation to skin cancer.


Their research had found Australians were relying on temperature or weather conditions to make decisions about risks from the Sun.
At the time, the UV index was not common knowledge – and was often misunderstood or misinterpreted.
They launched a memorable campaign to drive awareness of UV risk.

Improving the SunSmart application using
CAMS UV data
As technology improved, SunSmart diversified its strategies. In 2010 it developed a new application, aiming to bring UV information to the masses. In 2016 it sought the help of the Copernicus Atmosphere Monitoring Service.


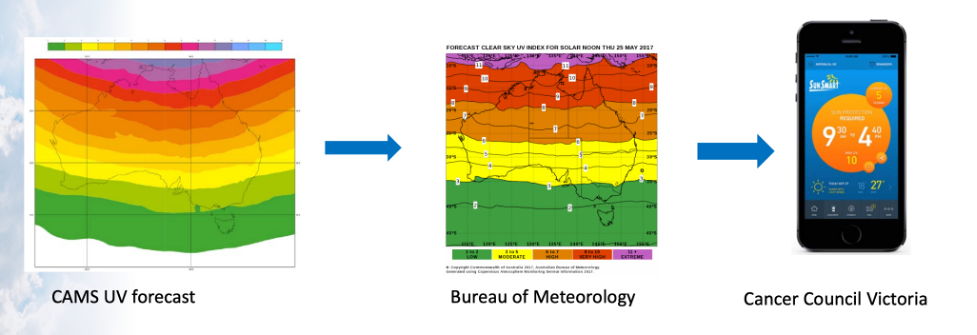
SunSmart, in collaboration with the Australian Bureau of Meteorology, feeds the daily CAMS UV index forecasts straight into its application. Credit: SunSmart
SunSmart, in collaboration with the Australian Bureau of Meteorology, feeds the daily CAMS UV index forecasts straight into its application. Credit: SunSmart
SunSmart wanted to use the CAMS daily UV index forecasts to inform more people about upcoming risks from UV radiation and provide warnings further in advance. The UV index forecast, produced by CAMS, is based on its operational forecasting system for atmospheric composition.
The data are used to generate a UV index for the application and highlight times when the index reaches three or higher. By using the location of the mobile device, it can inform users when to use Sun protection and provide information about UV levels, as well as associated information such as temperatures.
SunSmart application using CAMS data
Providing constantly updated UV data to mobile devices across Australia and beyond
The SunSmart application is free to download and available for anyone with a smartphone or tablet. It provides personalised recommendations about Sun protection, based on location, the time of day and UV levels. It offers live UV levels for major cities, and forecasts for all other locations around Australia.
It also advises on how much sunscreen people should apply depending on the UV radiation and the users’ skin types, as well as their choice of outfit. This includes reminders to top up every two hours.
The application offers five-day forecasts of Sun protection times, constantly updated with data obtained through CAMS.
The Australian Institute of Health and Welfare compiles information on skin cancer prevalence across the country. Since the introduction of the SunSmart programme, their data show that incidence of melanoma – a rare but potentially fatal form of skin cancer – is dropping for those aged 40 and under.


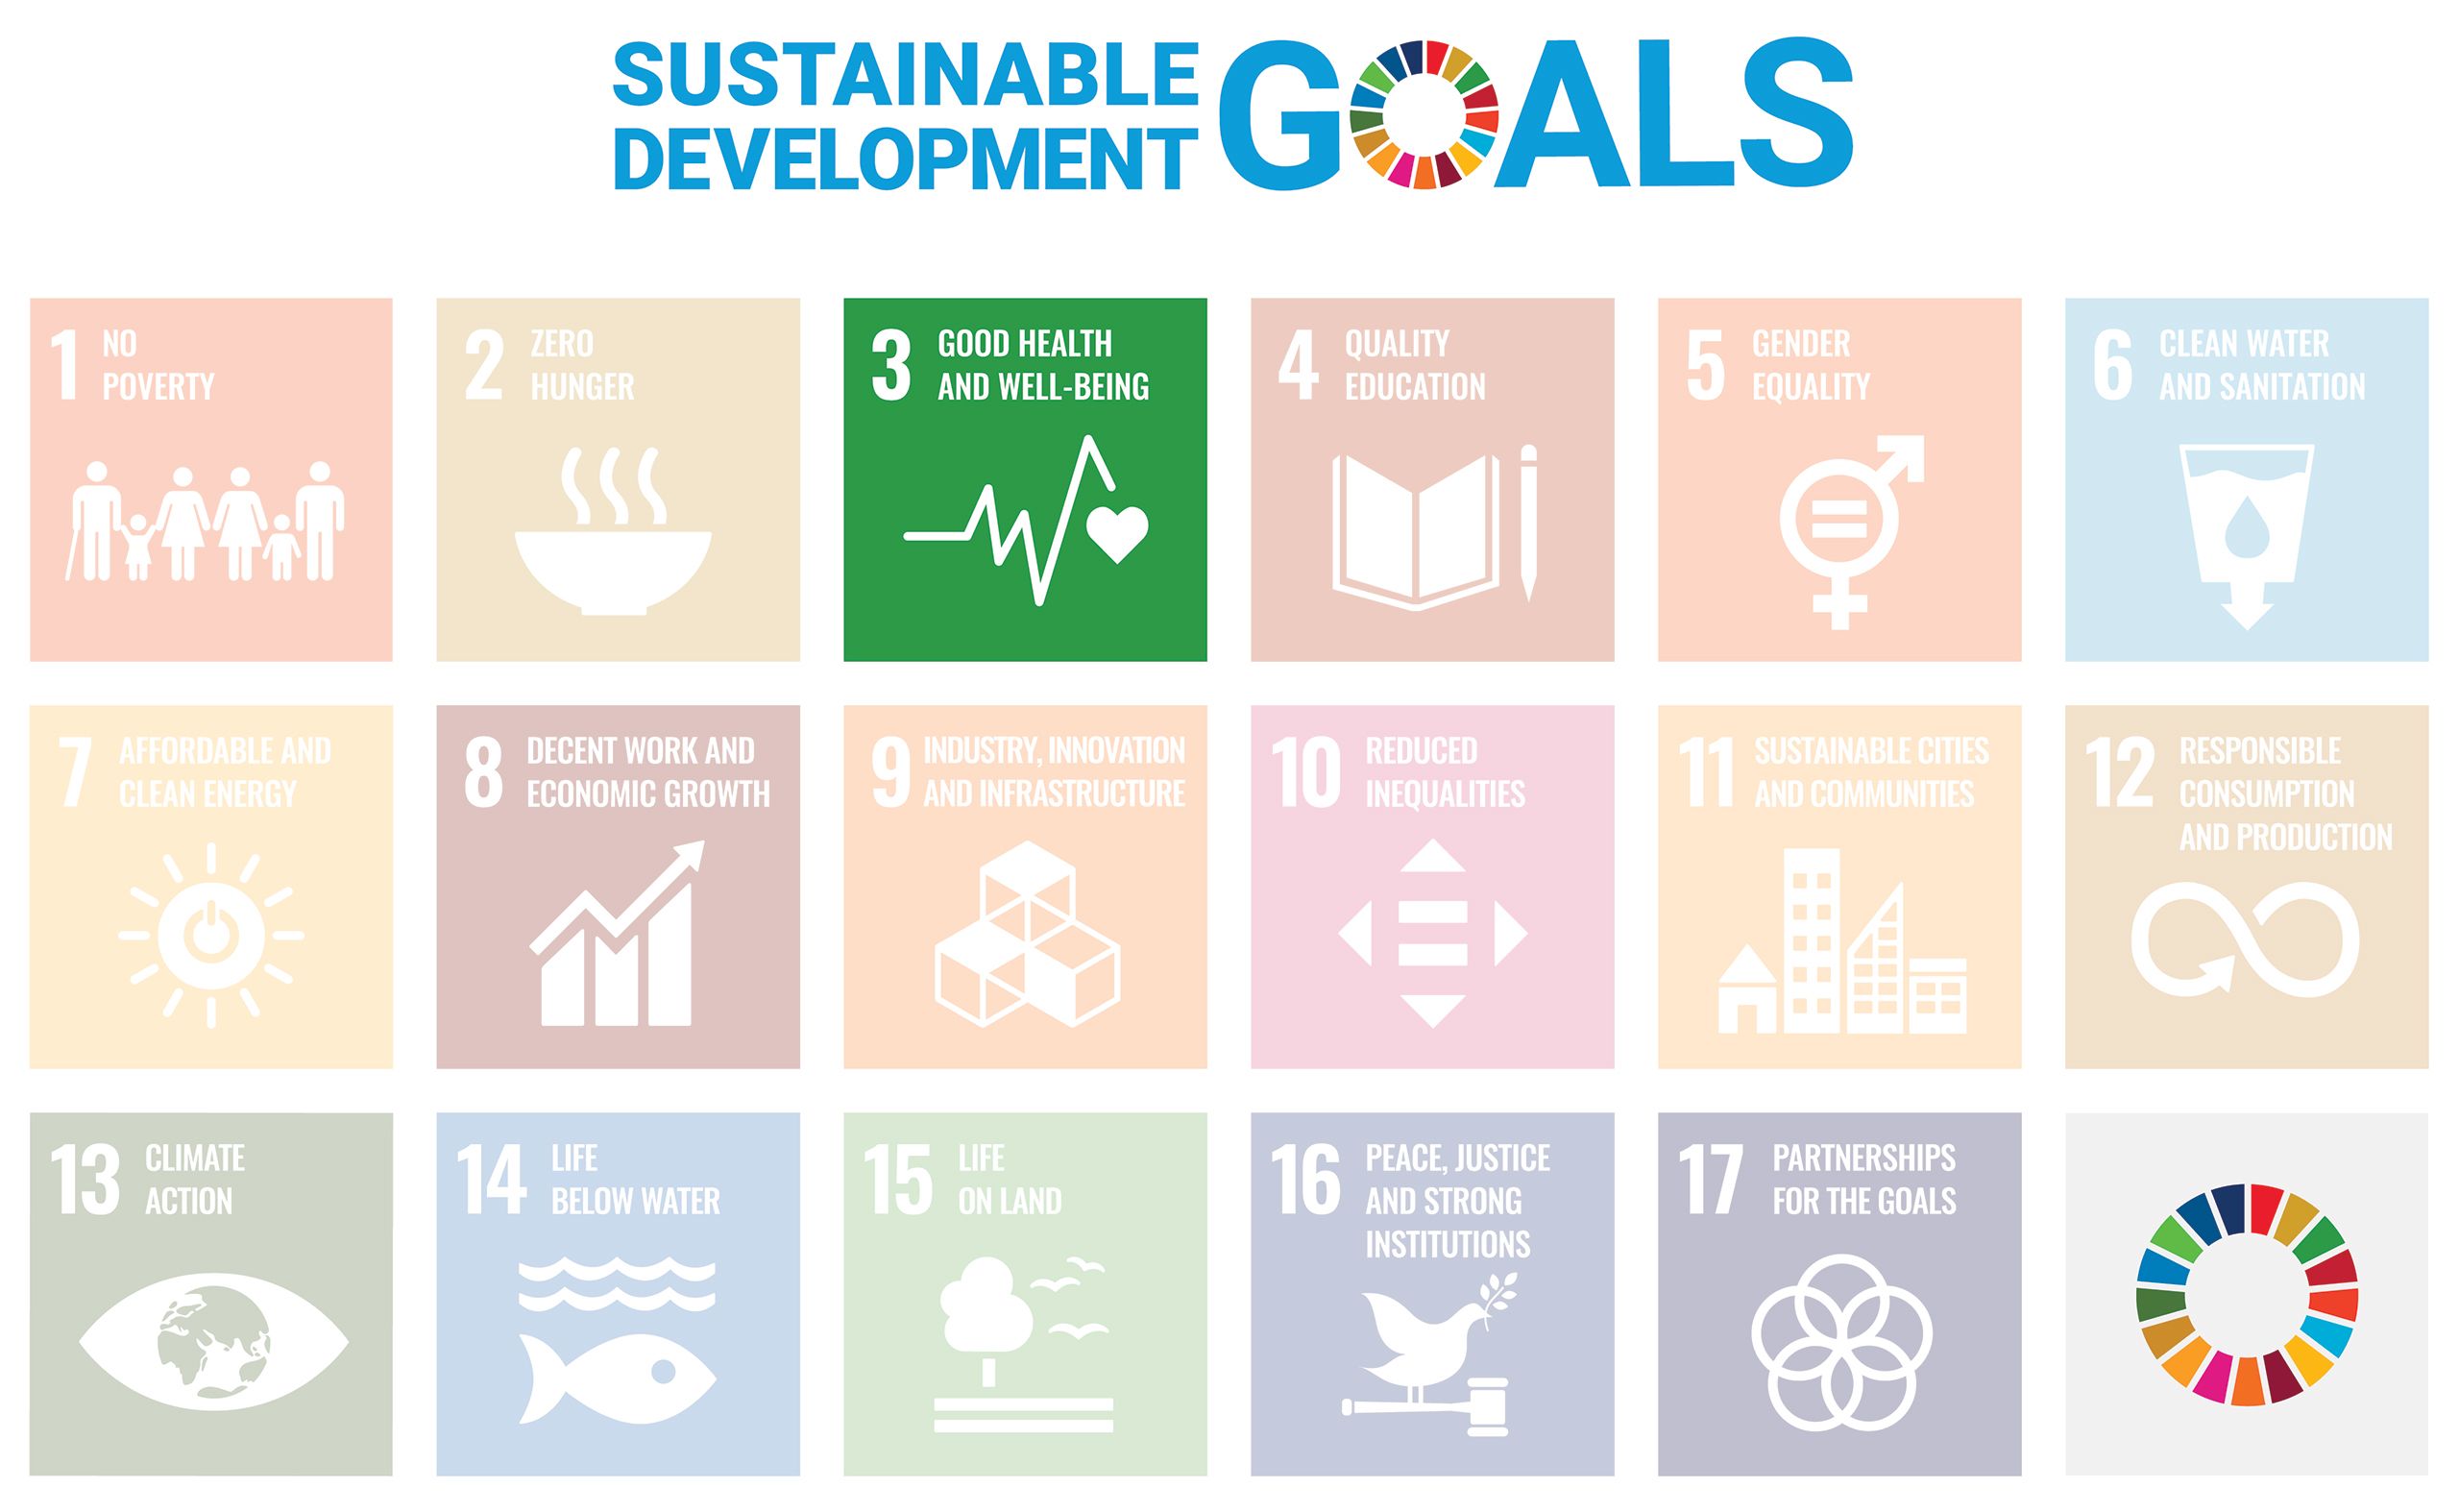
CAMS UV index data and the SunSmart application contribute to the
United Nations’ Sustainable Development Goal SDG 3:
Good health and well-being.
Data are already showing that skin cancer rates are dropping in line with the introduction of Sun protection advice through SunSmart. The application should dramatically increase the awareness of this advice and drive engagement, particularly in younger generations.
SDG 3 aims to ‘Strengthen the capacity of all countries, in particular developing countries, for early warning, risk reduction and management of national and global health risks’. Skin damage from UV radiation is an avoidable problem, and adequate warning and protection can help achieve this target. The application fulfils this vital aspect of the goal, offering an early warning for Australian citizens to avoid the natural hazard of UV radiation.
The SunSmart App is now also available in a global version aimed to improve global awareness on UV protection.