Insurance impacts of European windstorms
In late January 1990, Cyclone Daria hit Europe. The violent storm tore through the United Kingdom and northwestern continental Europe, leaving roughly $8.2 billion in insured losses and claiming the lives of dozens of people. It remains one of the most damaging windstorm events on record.

Extratropical cyclones produce a range of weather effects, from clouds and light showers to blizzards and storms; they are the most significant contributor to natural catastrophe insurance loss in Europe. Globally, they cost the insurance industry roughly $221 billion each year. European windstorms often cluster together, compounding losses. For example, after Cyclone Daria, seven more storms hit Europe over the following five weeks. But individual storms are bad enough on their own: Storm Lothar in 1999 brought an estimated $8 billion in damages and Xynthia struck in 2010, costing $6 billion.
Supported by the Copernicus Climate Change Service (C3S), the Royal Netherlands Meteorological Institute (KNMI, Koninklijk Nederlands Meteorologisch Instituut), has investigated the risk of these damaging storms, so that the insurance industry can prepare and develop premiums accordingly. Using reanalysis datasets and a set of synthetic events, they worked out the historical storm footprints, which can be used to assess what current costs would be, should similar storms strike today.


Assessing the risk
European windstorms can occur throughout the year but are particularly common and intense between October and March. The winter season poses favourable meteorological conditions for the windstorms to form and become intense.
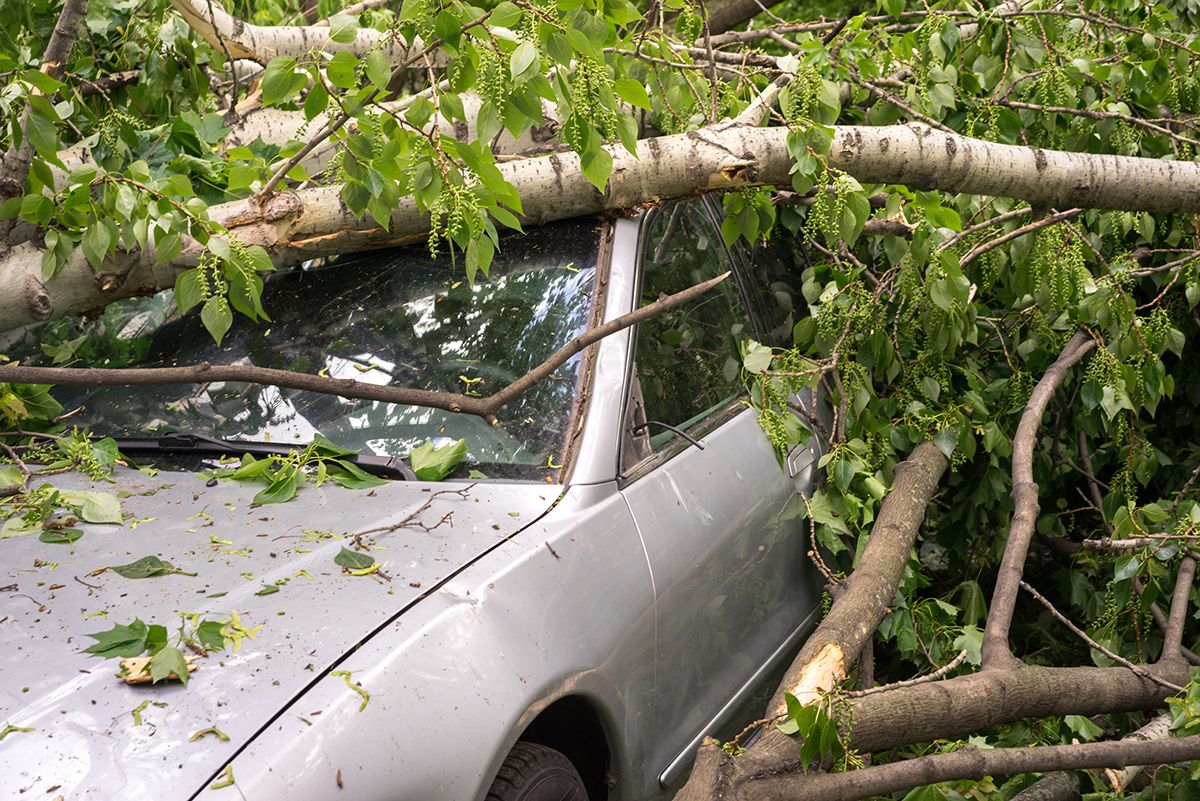
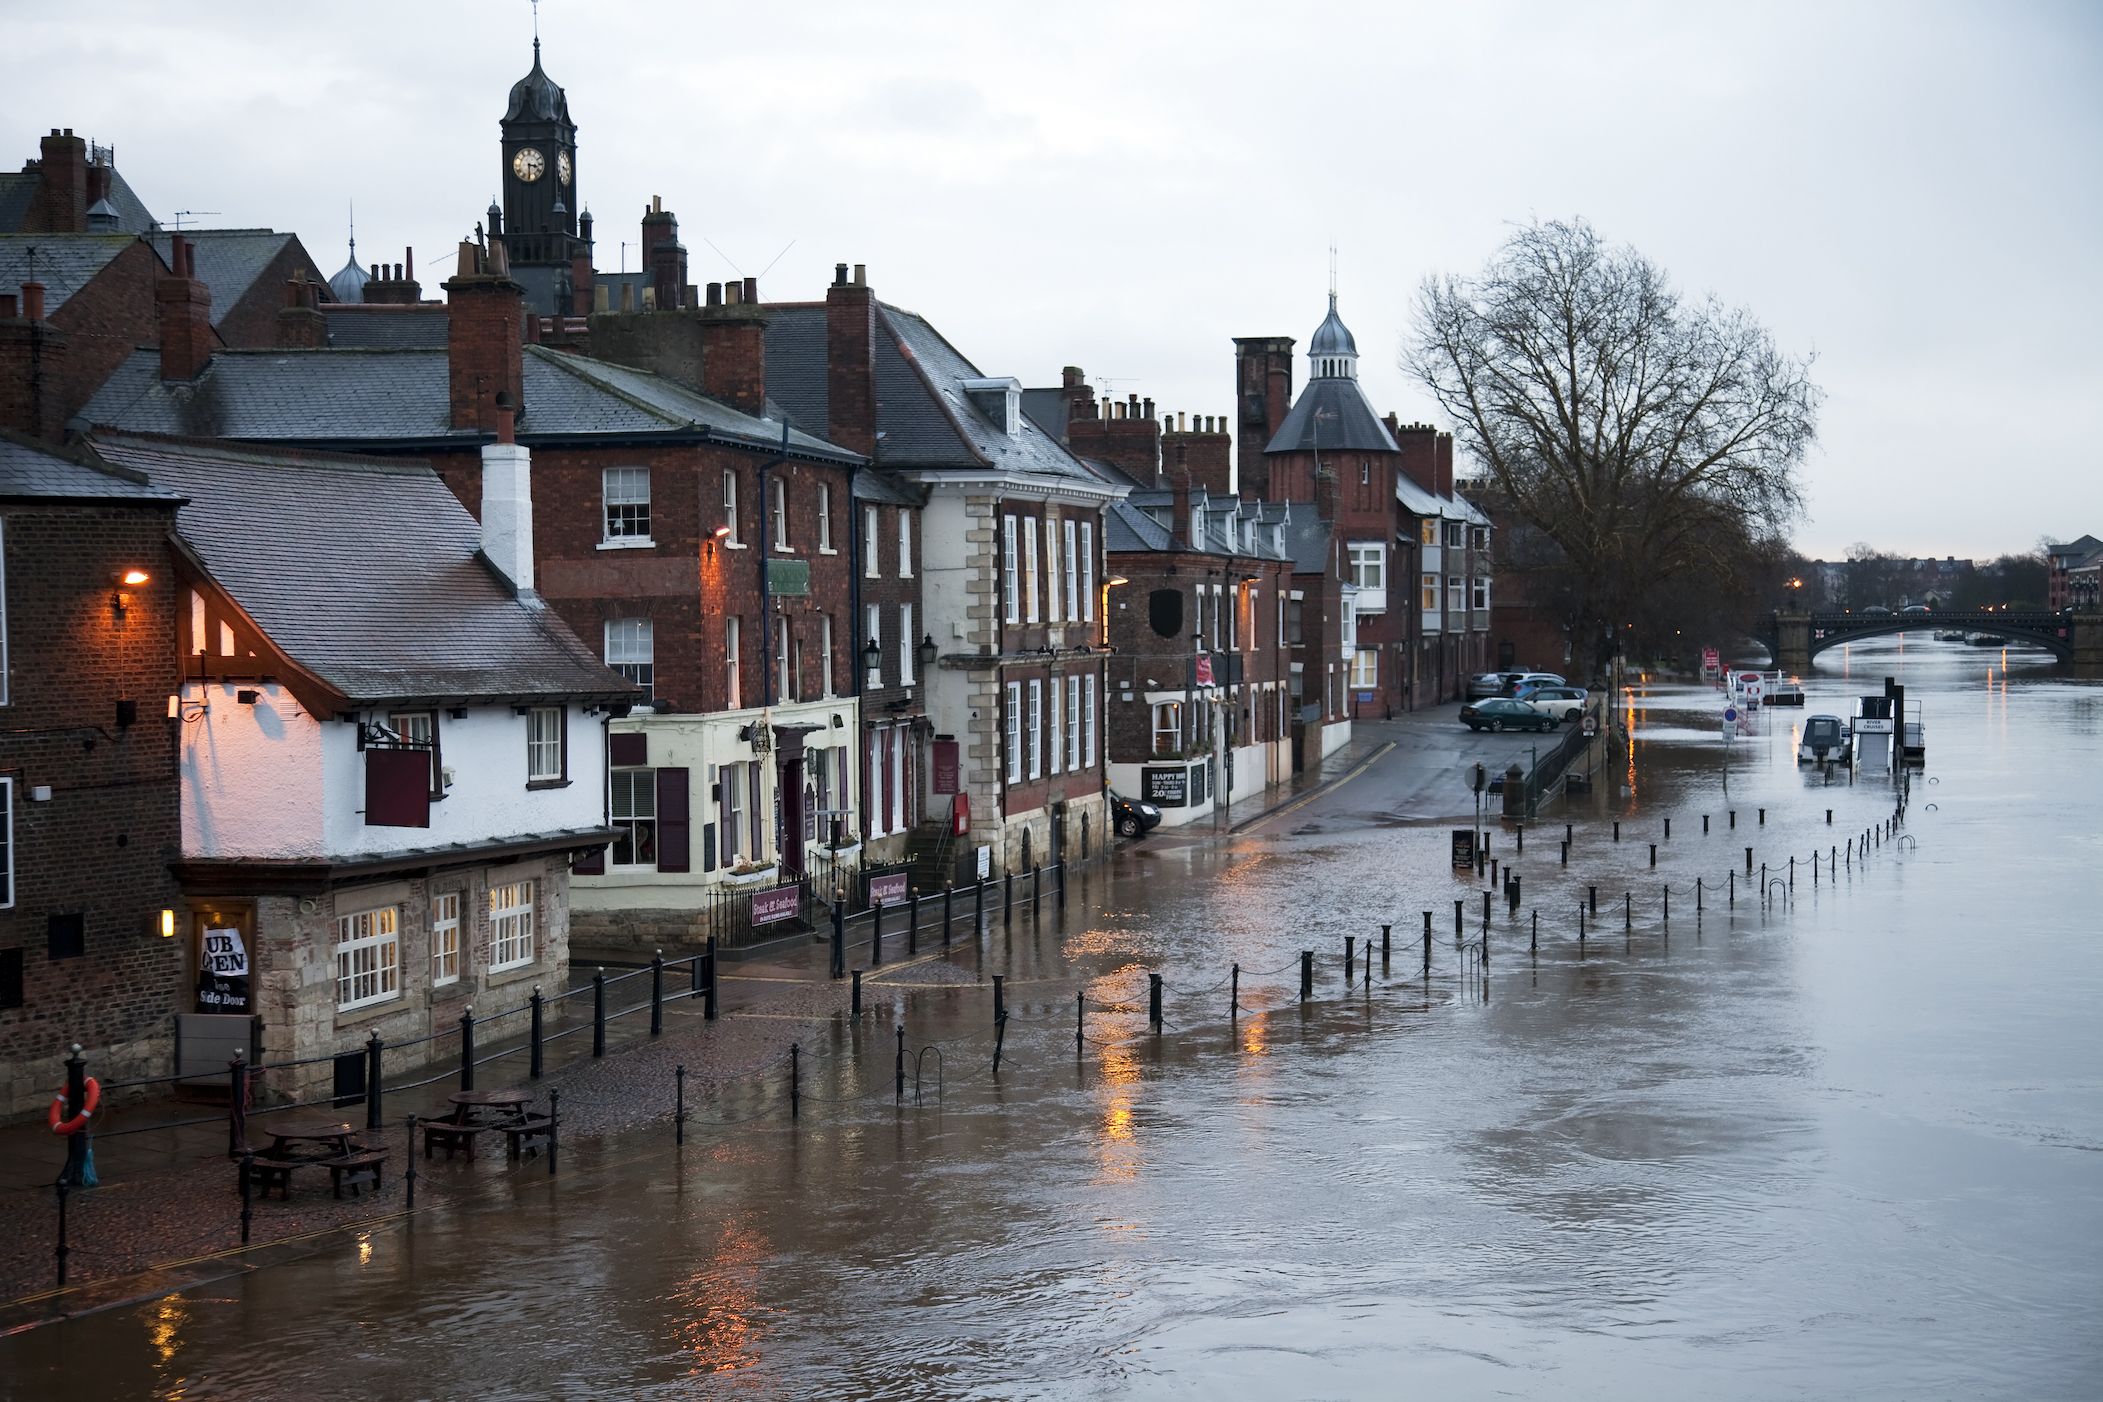
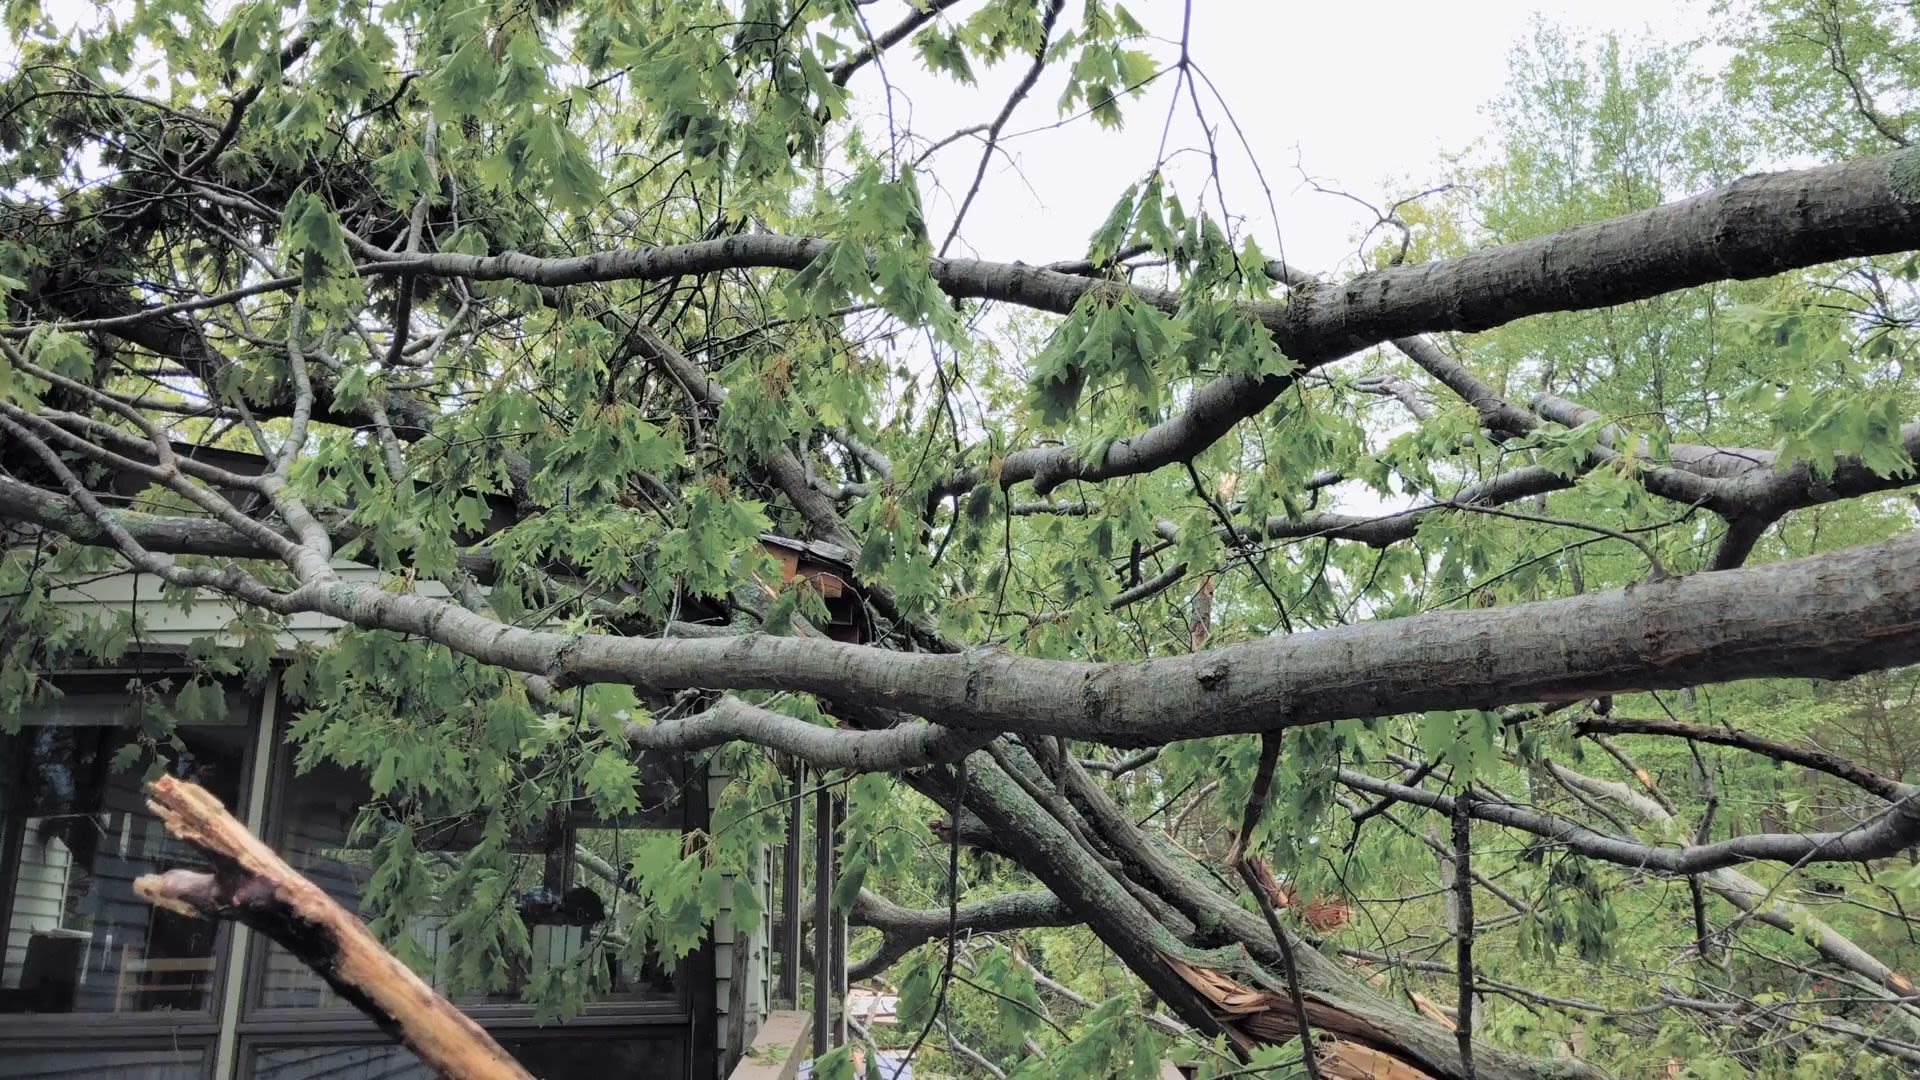
Should a windstorm track over land, the high wind speeds can cause significant damage; uprooting trees, damage buildings and infrastructure.


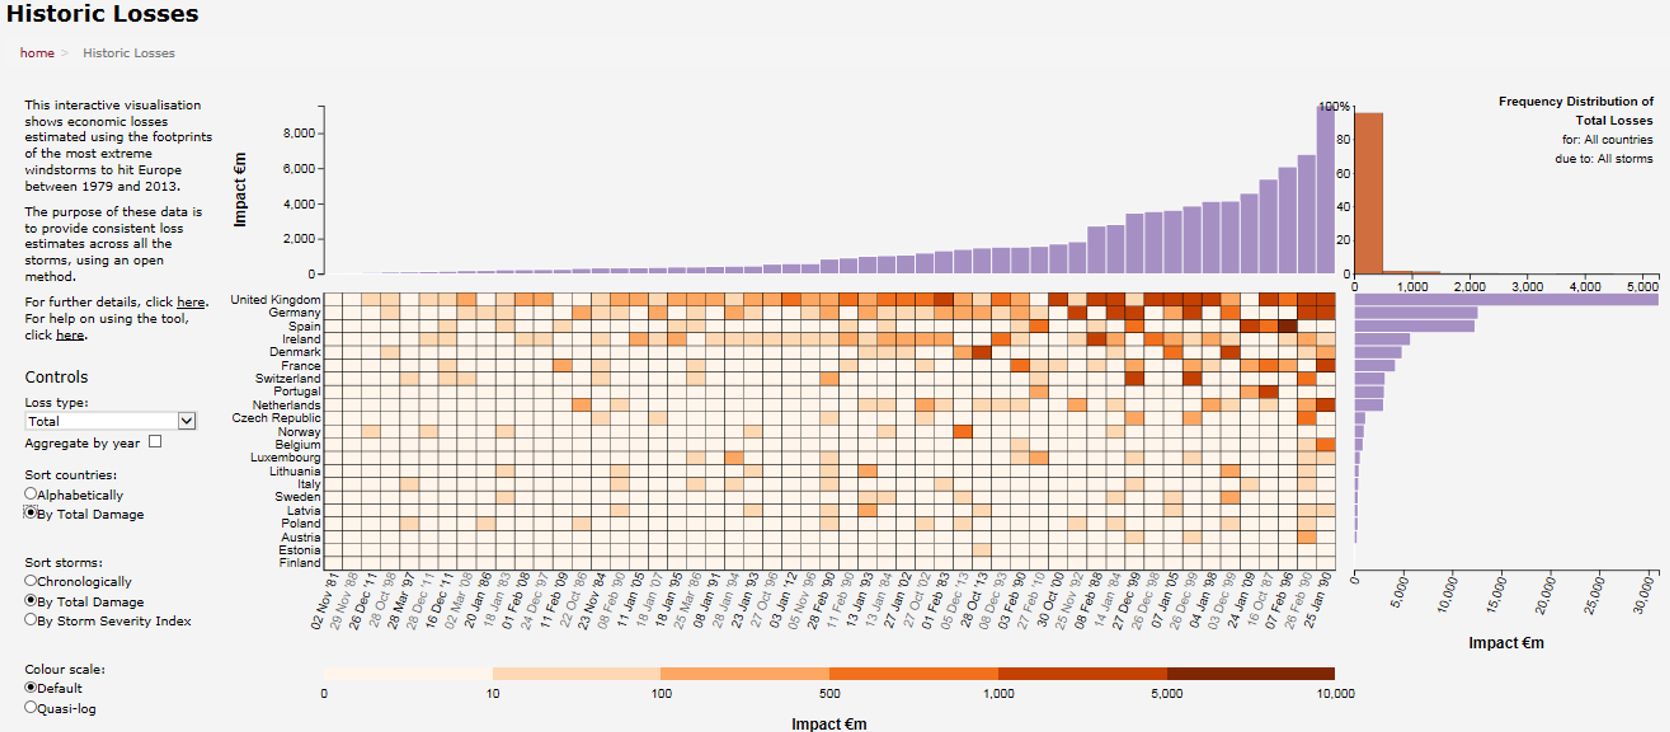
Distribution of economic losses from European windstorms 1979–2013, sorted by event. Credit: Copernicus Climate Change Service, ECMWF.
Distribution of economic losses from European windstorms 1979–2013, sorted by event. Credit: Copernicus Climate Change Service, ECMWF.
Insurers need to understand the risks from and likelihood of such damaging and intense windstorms, so they can set appropriate premiums for buildings in particular areas. Gathering this vital information requires accurate and consistent analysis of historical storms. Once past trajectories and windspeeds are understood, researchers can project the range of possible extremes, and easily assess the vulnerability of insured buildings, infrastructure and vehicles to the powerful gusts of wind brought by the storms.

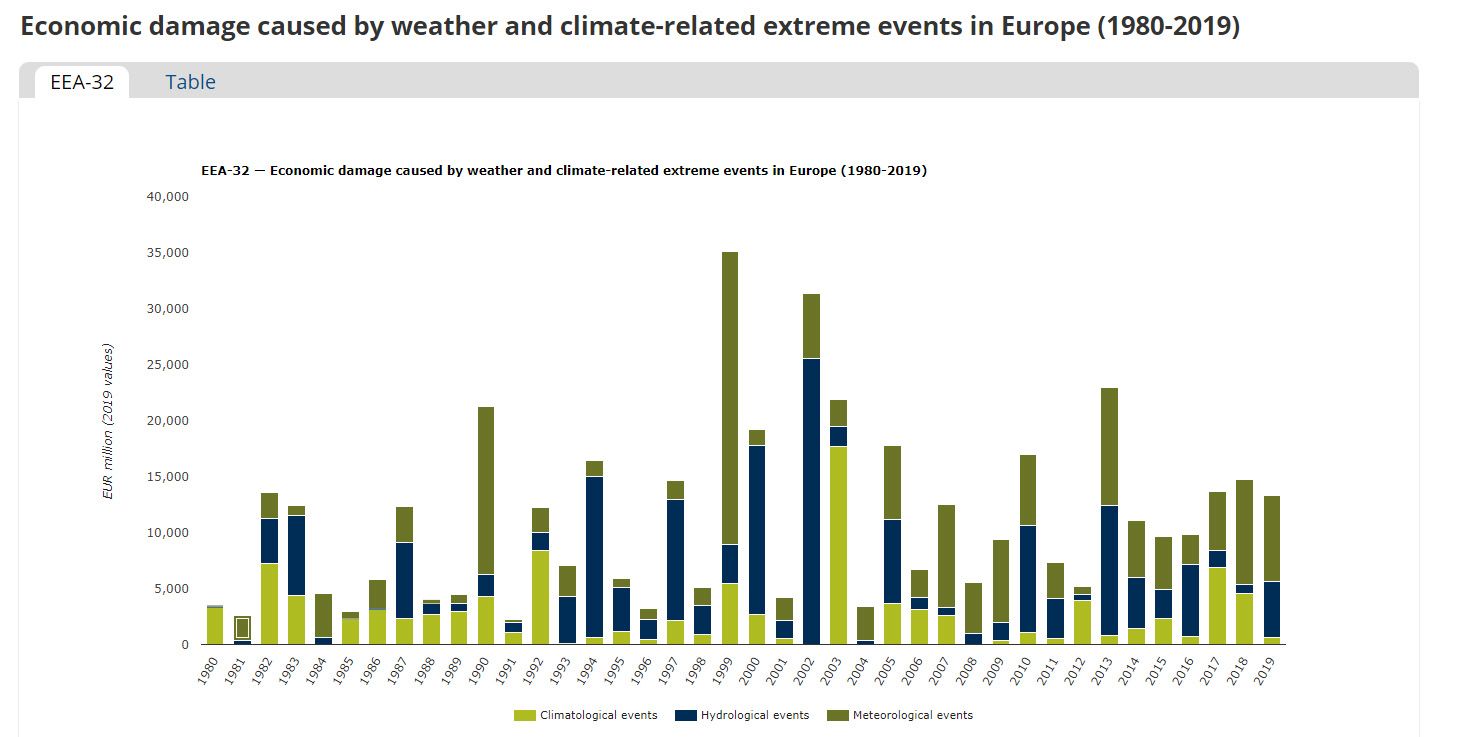
Economic damage caused by weather and climate-related extreme events in Europe (1980-2019). Credit: EEA.
Economic damage caused by weather and climate-related extreme events in Europe (1980-2019). Credit: EEA.
The United Nations’ Intergovernmental Panel on Climate Change (IPCC) predicts extreme weather events will become more frequent around the world under a changing climate. However, the link between climate change and extratropical cyclones is currently unclear. European windstorms have actually reduced in frequency in the past few decades.
Nevertheless, meteorological events such as windstorms cause economic damage across Europe. Tracking and understanding them is vital to protect European infrastructure and buildings, and to avoid disastrous costs for the insurance industry.
European windstorms and climate change
An unclear picture

Climate change increases variability within the dynamics of the Earth system, and scientists generally agree that extreme weather events are more likely to become more frequent and intense because of it.

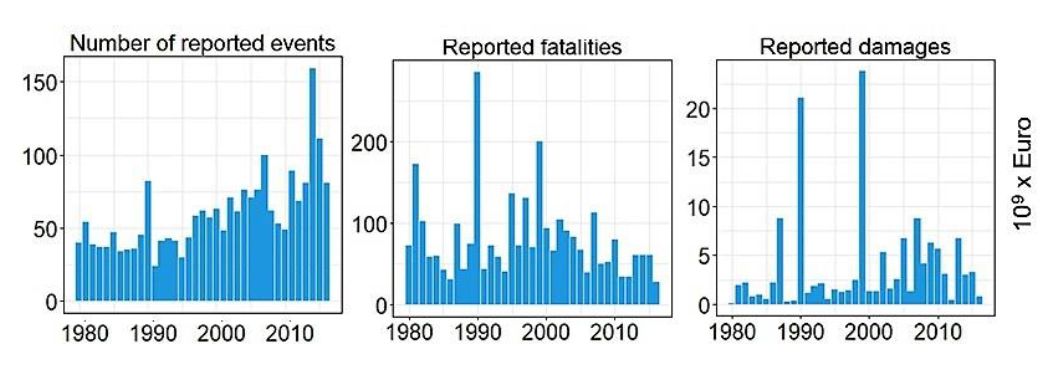
Evolution in time of the total number of reported wind events, fatalities, and damage in Europe between 1981 and 2016. Credit: Munich Re NatCatSERVICE disaster database.
Evolution in time of the total number of reported wind events, fatalities, and damage in Europe between 1981 and 2016. Credit: Munich Re NatCatSERVICE disaster database.
Yet the impact of climate change on the distribution and intensity of European windstorms remains under debate. Though insurance damages increased throughout the 20th century, this trend is not reflected in the data on storm intensity.
Detailed and accurate long-term records of storm gusts are lacking, and there is a paucity in storm intensity data prior to 1940. One limitation with modelling windstorms is the availability of high resolution spatial and temporal wind data; they are too coarse to capture severe local windstorms. The current generation of climate models also struggle to reproduce wind dynamics, leading to a relatively poor physical representation.
However, researchers have discovered distinct wind phenomena characterising European windstorms. One of these is ‘sting jets’, which are unique in their ability to bring exceptional gusts of wind well inland. There is some evidence that these may become more prevalent under climate change.
Even without a strong link to climate change,
European windstorms consistently cause insurance losses. Monitoring their impacts is key to informing future policy and mitigation, while ensuring that premiums on public and private buildings and infrastructure are adequate to cover the cost of storm occurrences.
Finding data on storm pathways, footprints and estimates of damages
Insurers take many factors into account when deciding what level of premium to apply. One key piece of information is the risk of unusual or unpredictable events. To assess this, insurers use a mixture of historical records and future predictions. This helps them determine the worst-case scenarios, which can be used to generate an appropriate premium.
Institutes such as KNMI can manipulate the high-quality C3S data to provide this information to the insurance industry.
Calculating windstorm information from ERA5
As historical records of windstorms are inconsistent, reanalysis data are vital. A reanalysis uses models to fill in gaps in historical observationscop74.
C3S’ cutting edge ERA5 reanalysis has high resolution data on climate variables from 1979 to the present. The KNMI team used ERA5 data to derive indicators on European winter windstorms to support the insurance sector in making quantitative assessments.
Windstorm indicators of the past like storm footprints and storm tracks derived from ERA5, available in the Climate Data Store (CDS), provide a useful historical baseline to characterise the geographic and and temporal distribution of potentially destructive events in Europe.
Combining the windstorm indicators of the past storms with a set of plausible windstorm events enhances the potential for insurers to estimate the risk associated with a windstorm. A set of nearly 23,000 plausible storm events was developed for Europe from 1985 to 2011, based on modelled climate conditions.
“The high-resolution, bias-corrected windstorm indices based on C3S climate data add value to our risk analysis tools”

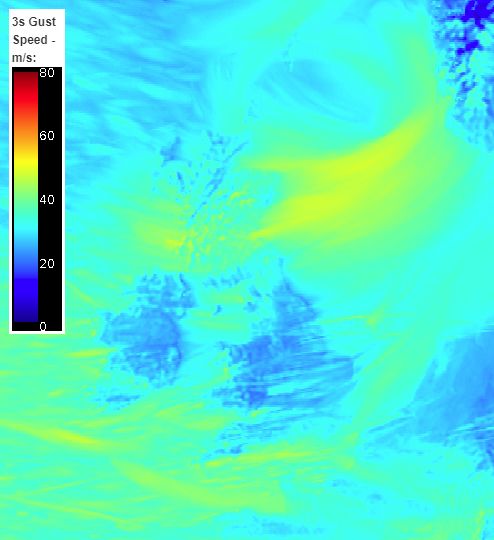
Storm footprint for Storm Lothar (26 December 1999). A storm footprint is based on the exceedance of a windspeed threshold. Credit: Copernicus Climate Change Service, ECMWF.
Storm footprint for Storm Lothar (26 December 1999). A storm footprint is based on the exceedance of a windspeed threshold. Credit: Copernicus Climate Change Service, ECMWF.
Estimated Losses
Ultimately, the insurance industry needs to understand how the track and footprint of a storm will translate into economic losses.
Data on the financial loss is derived from the windstorm footprint and combined with information on the building characteristics and its geography, making the financial loss available at each building location.
Insurers also need information on the economic risk for a specific building, taking into account a range of plausible conditions. These risk indicators are available through the CDS and describe the expected yearly socio-economic impact of windstorms in Europe, representing the average annual damage.
The loss and risk data provided by C3S can be used by insurers to check against their own proprietary information.

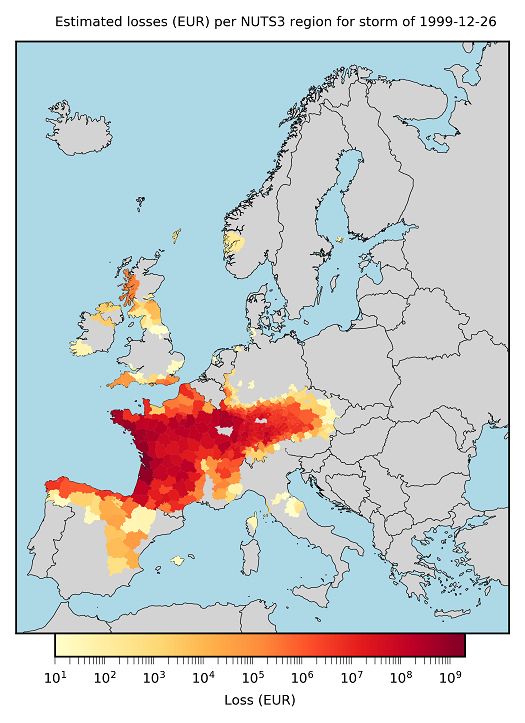
Loss profile for Storm Lothar, 26 December 1999. Credit: Copernicus Climate Change Service, ECMWF.
Loss profile for Storm Lothar, 26 December 1999. Credit: Copernicus Climate Change Service, ECMWF.
Practical applications for the insurance industry
From the windstorm data available through the CDS, the team at KNMI could analyse all historical footprints to determine the maximum strength of all storms in every location.
Overall, the assessments made through the case study are useful for insurers when underwriting contracts for individuals and organisations. In making the insurance industry more secure, this also boosts mitigation policies to adapt for climate change, as risk assessments can be carried out in specific regions to higher accuracy.
Certain challenges arose through the processing of data.
There is a lower spatial resolution of wind data for coastal regions, masking the exact likelihoods of windstorms in these areas. This is potentially problematic as offshore winds are generally higher and the propensity for damage is greater.
Another challenge is that modelling does not show all details of what happens in the atmosphere. This can lead to potential miscalculations in damage estimates, as they are not always proportional to the overall intensity of a storm.


Building future resilience to increased wind risk
In helping model potential risks from windstorm damages, the project contributes to two of the United Nations’ Sustainable Development Goals (SDGs).
SDG 9: ‘Industry, innovation and infrastructure’
The datasets and derived information from the case study help insurers set premiums based on an accurate prediction of risks in the face of potential future windstorms. This can encourage urban planners, developers and local governments to improve resilience to climate change.
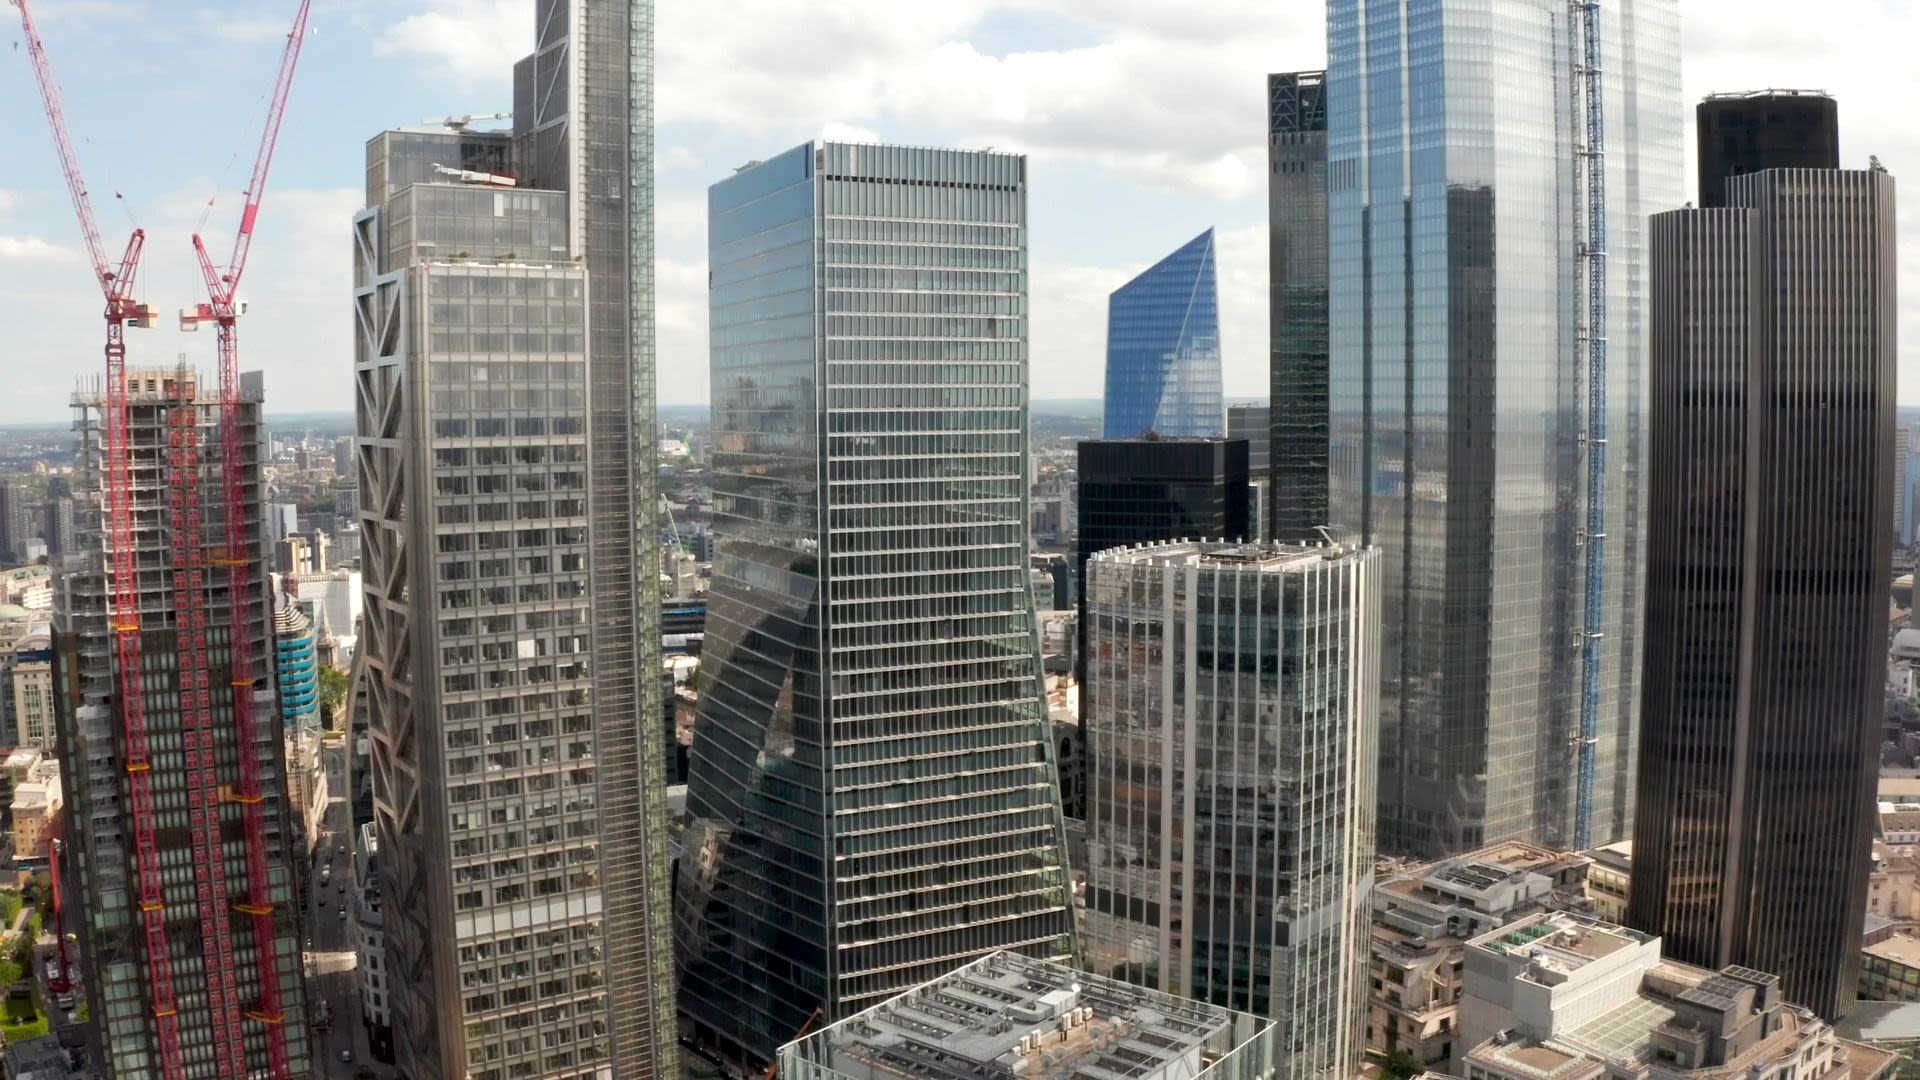
SDG 11: ‘Sustainable cities and communities’
Beyond the insurance industry, the knowledge gained through this project will be invaluable for cities to plan for the future and start working to mitigate against future natural disasters. For example, the data can be used by structural engineers to assess which regions of a city might be most impacted by windstorms and adapt major infrastructure accordingly.
Specifically, finding out the probable maximum wind speeds can lead to improved designs in structures from wind turbines to mobile phone masts to electricity pylons to bridges, and even to improve residential buildings.
The datasets and windstorm analysis are useful to the insurance industry, but information on extreme winds could be just as useful to those working in energy, transport, civil engineering and governments. In this way the project helps many sectors build future resilience to extreme windstorms.
Although a solid link between climate change and European windstorms is yet to be established, preparing for a world of more extreme weather will still be necessary. Incorporating risk assessments of extreme winds into building refurbishments or new designs can only serve to make communities and cities more resilient to the coming impacts of climate change.
Many buildings have been constructed in vulnerable locations, as described in the UN’s ‘The Sustainable Development Goals Report’ in 2017. The approaches used through this case study can be adapted to analyse these weaker locations in greater detail. As some buildings in exposed areas have already been built with vulnerability to windstorms taken into account, this new information can be used to continue the evolution of such designs, to make them gradually more resilient to potential changes over the next decades.