Global Crop Monitoring
Transforming climate data into practical information for agriculture

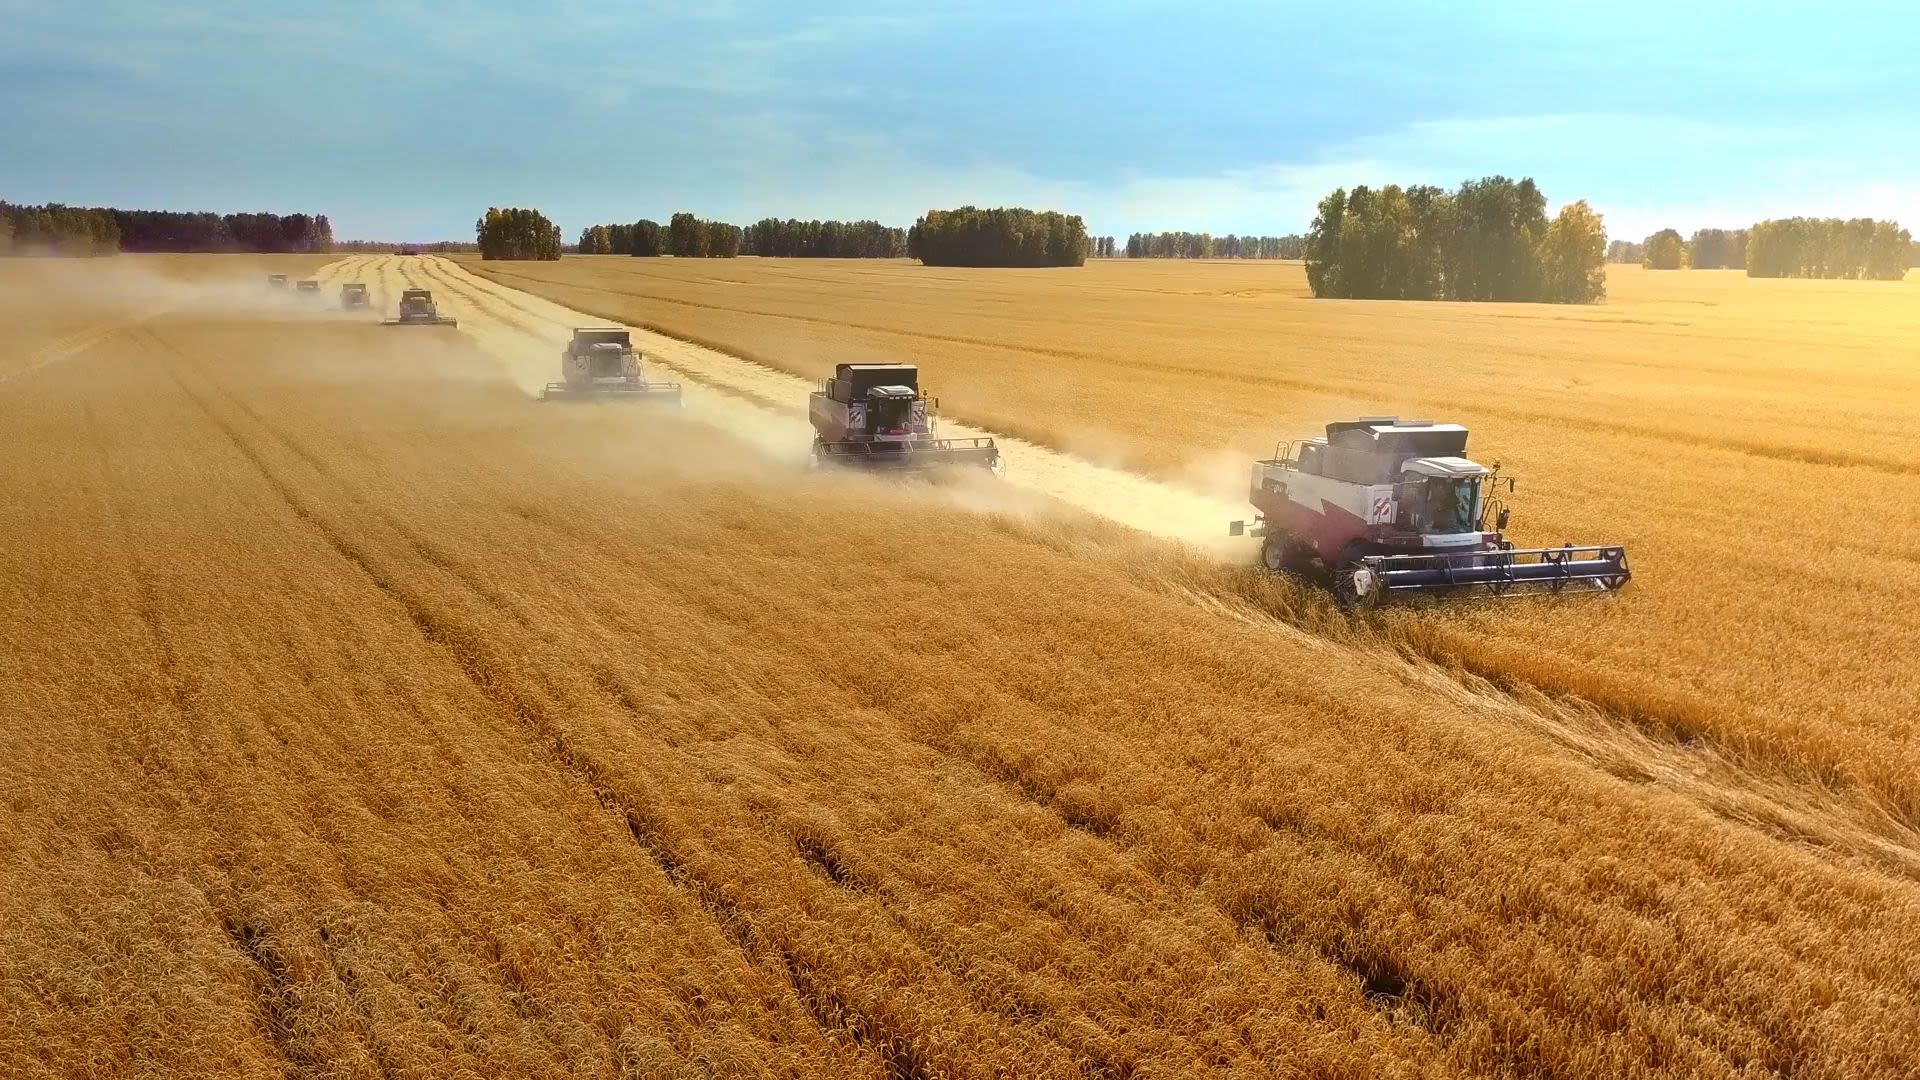
Over the next few decades, the world’s booming population will need more food than has ever been produced in human history.
Growing populations are straining the global food system, while climate change is altering rainfall patterns, raising surface temperatures and increasing the likelihood of extreme weather events – all of which affect cropland and agricultural productivity. To ensure food security, we need reliable, accurate and trusted data.
Most models simulating the impact of climate change on agriculture and its relationship with the environment require specific types of input data, which can be difficult to obtain. Supported by the Copernicus Climate Change Service (C3S), a team of researchers led by Wageningen University & Research developed a global dataset specifically tailored to support global agriculture. This dataset can be used by the agricultural industry, as well as by governments and NGOs, to monitor global crop production and improve food security.
Sustainable crop production
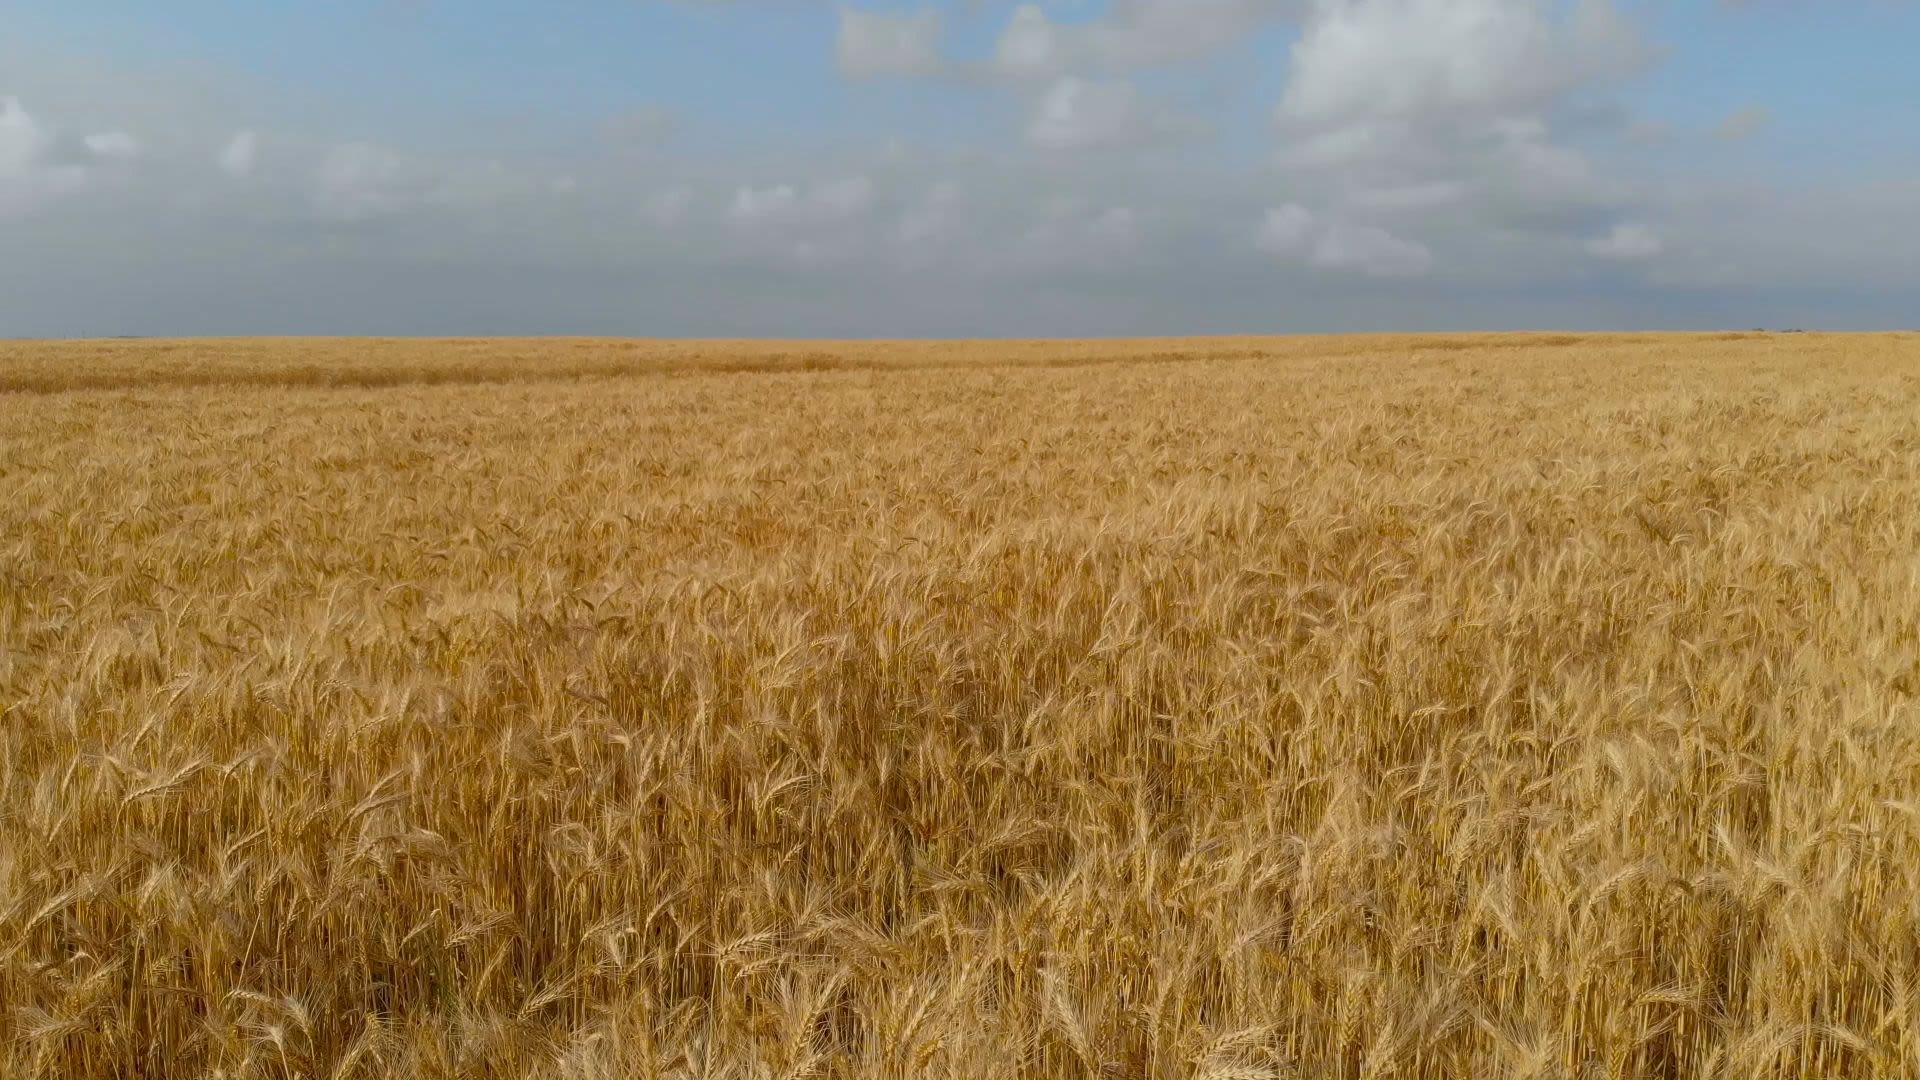
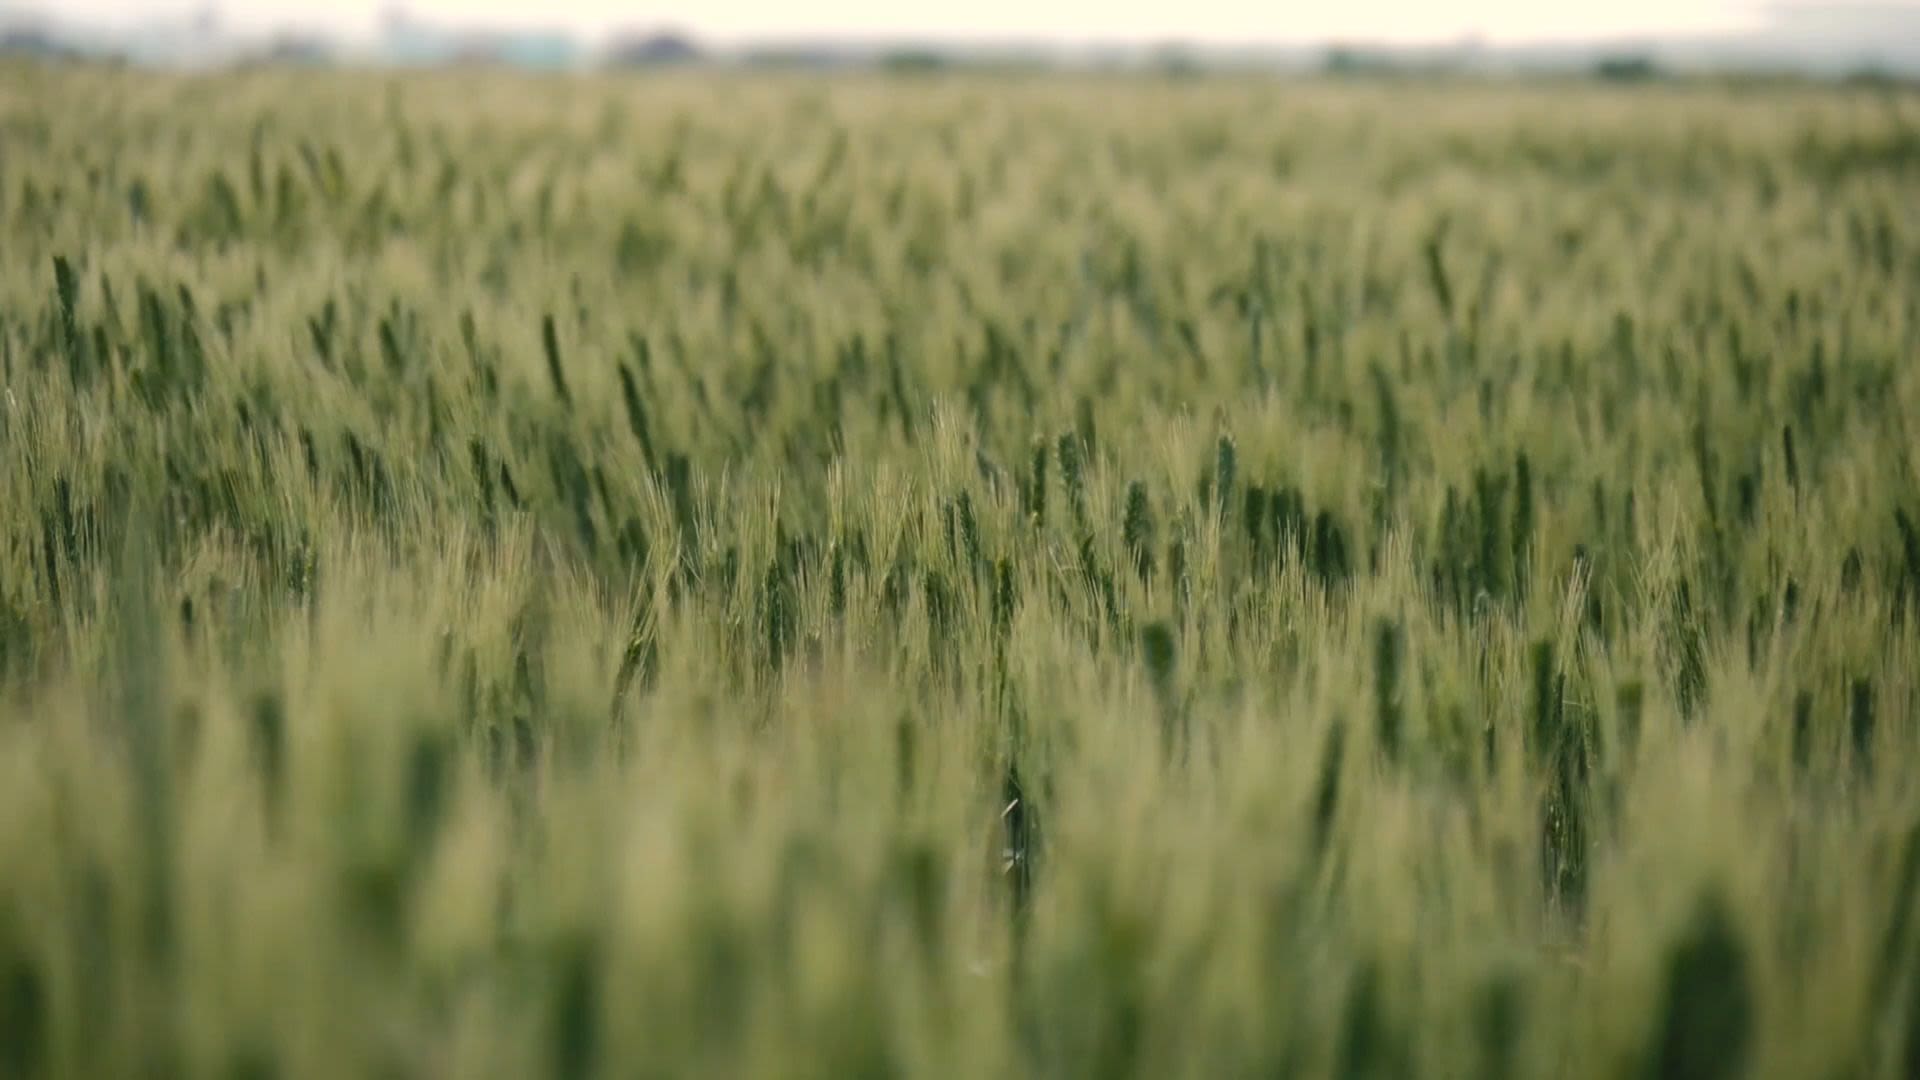
Each year, farmers around the world face new challenges affecting the success of their crops. Multiple factors including climate change and land management can affect crop yield, so regional crop success can differ largely from year to year. Understanding and predicting such shifts in crop yields is key to future sustainable crop production.
Reduced crop yields can push food prices up, risking the food security of vulnerable populations, especially those in regions hardest hit by climate change. The Intergovernmental Panel on Climate Change (IPCC) predicts that the cost of cereal will rise by up to a 29% by 2050 due to climate change if emissions are not curbed until 2080 (RCP 6.0); this would significantly impact global food prices.

Climate change brings new challenges
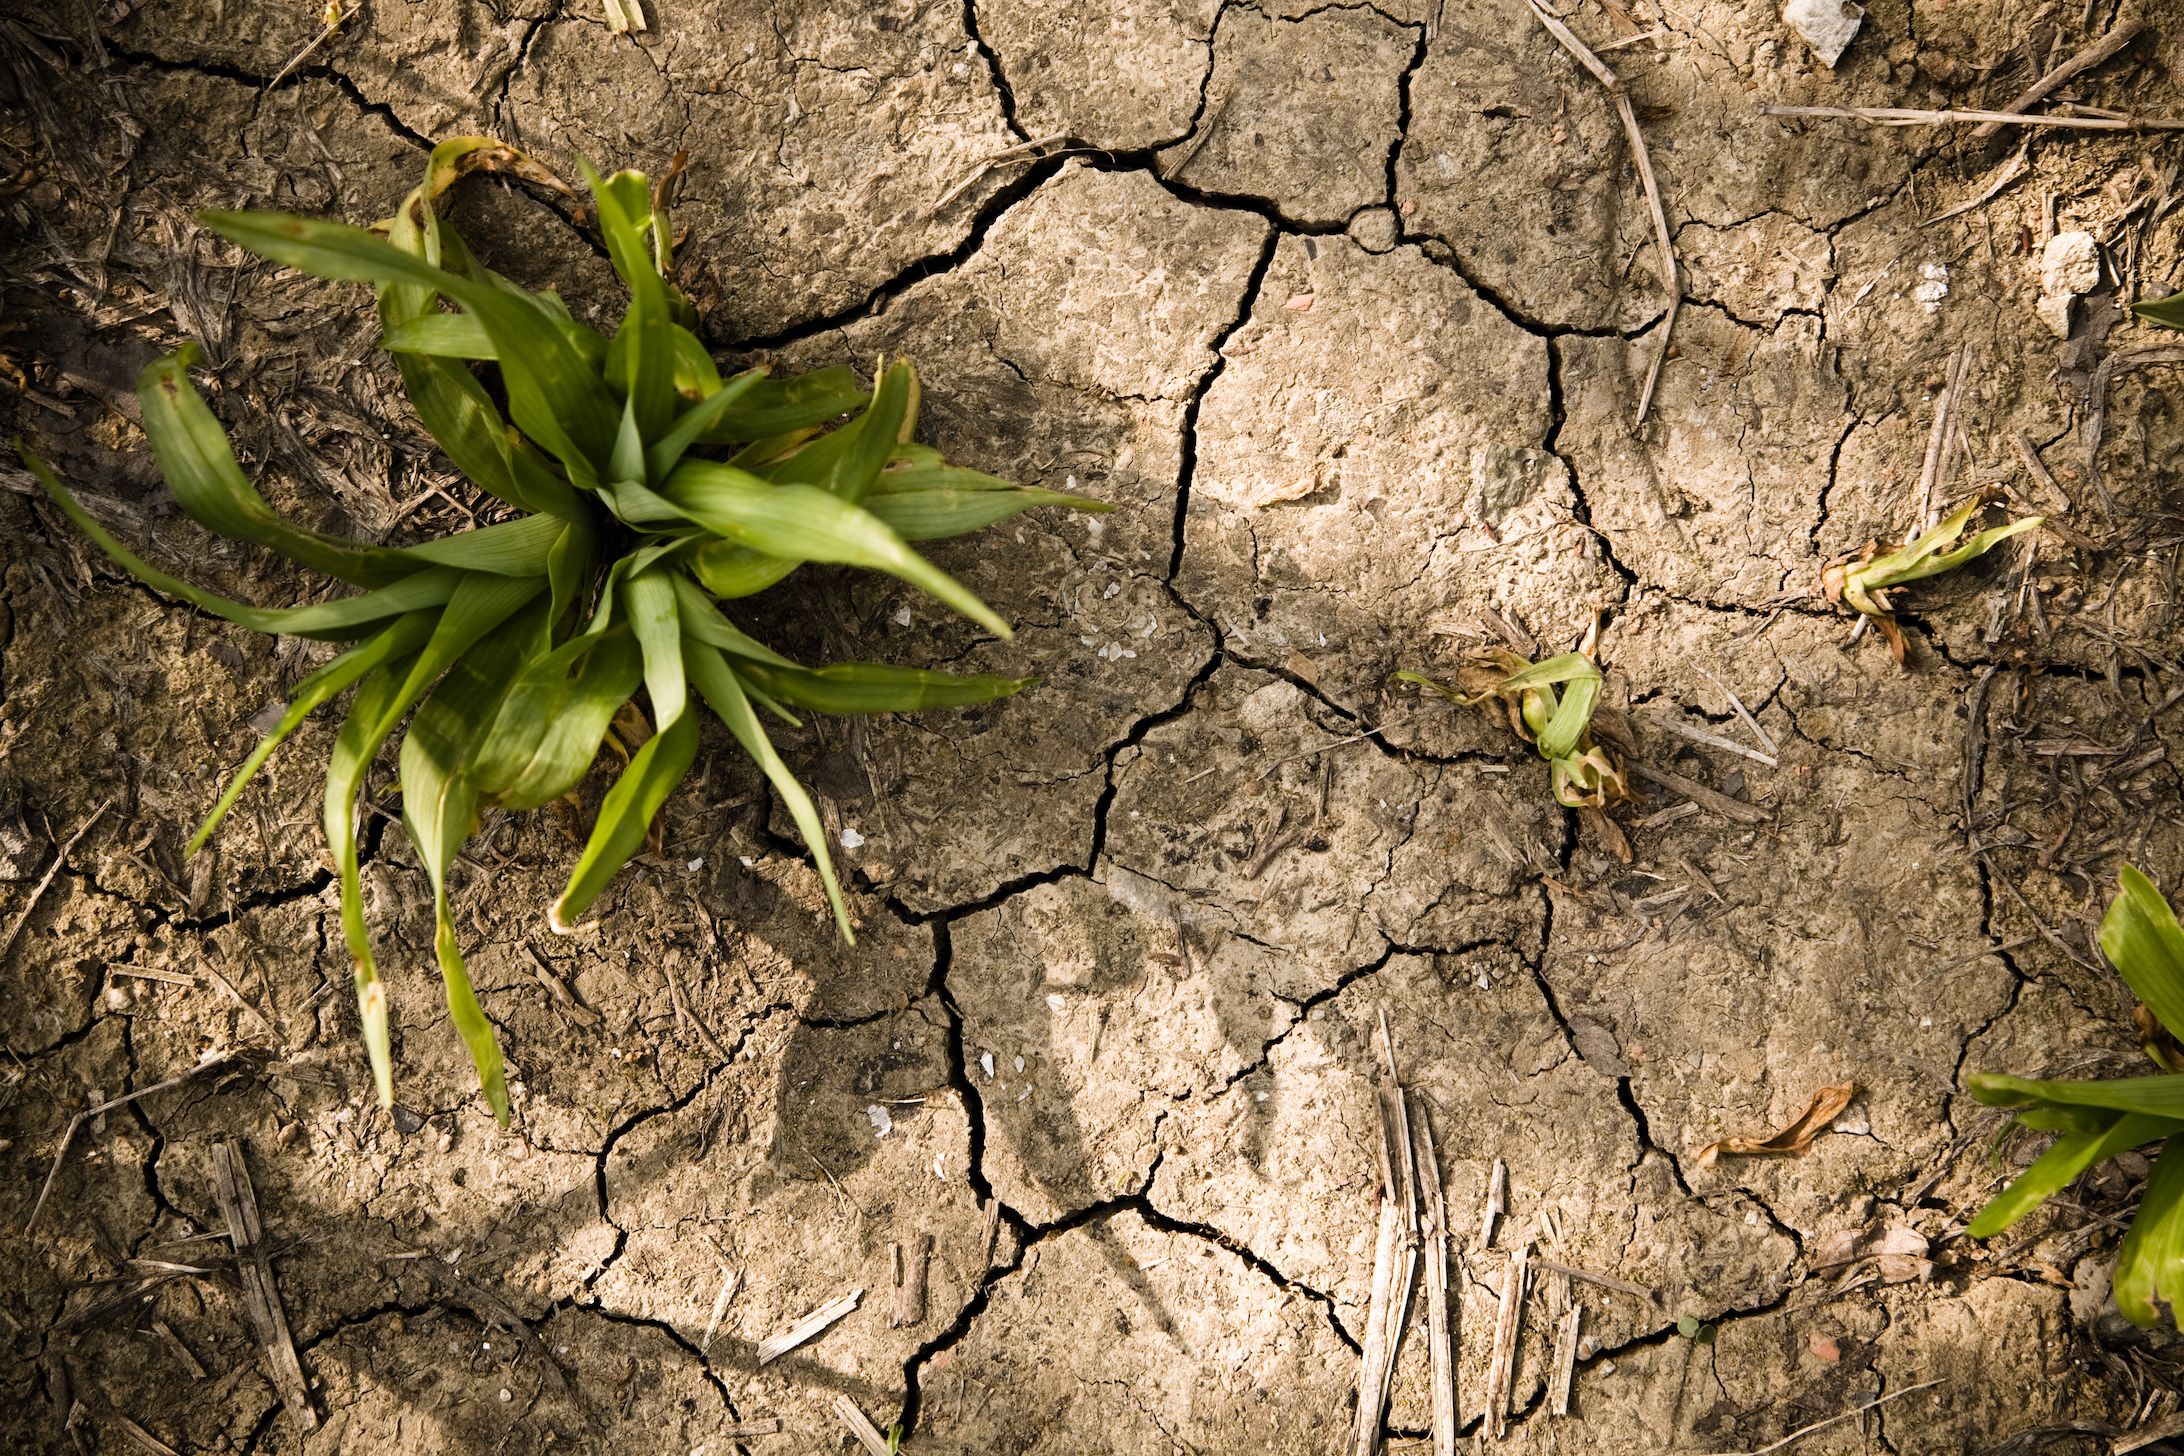
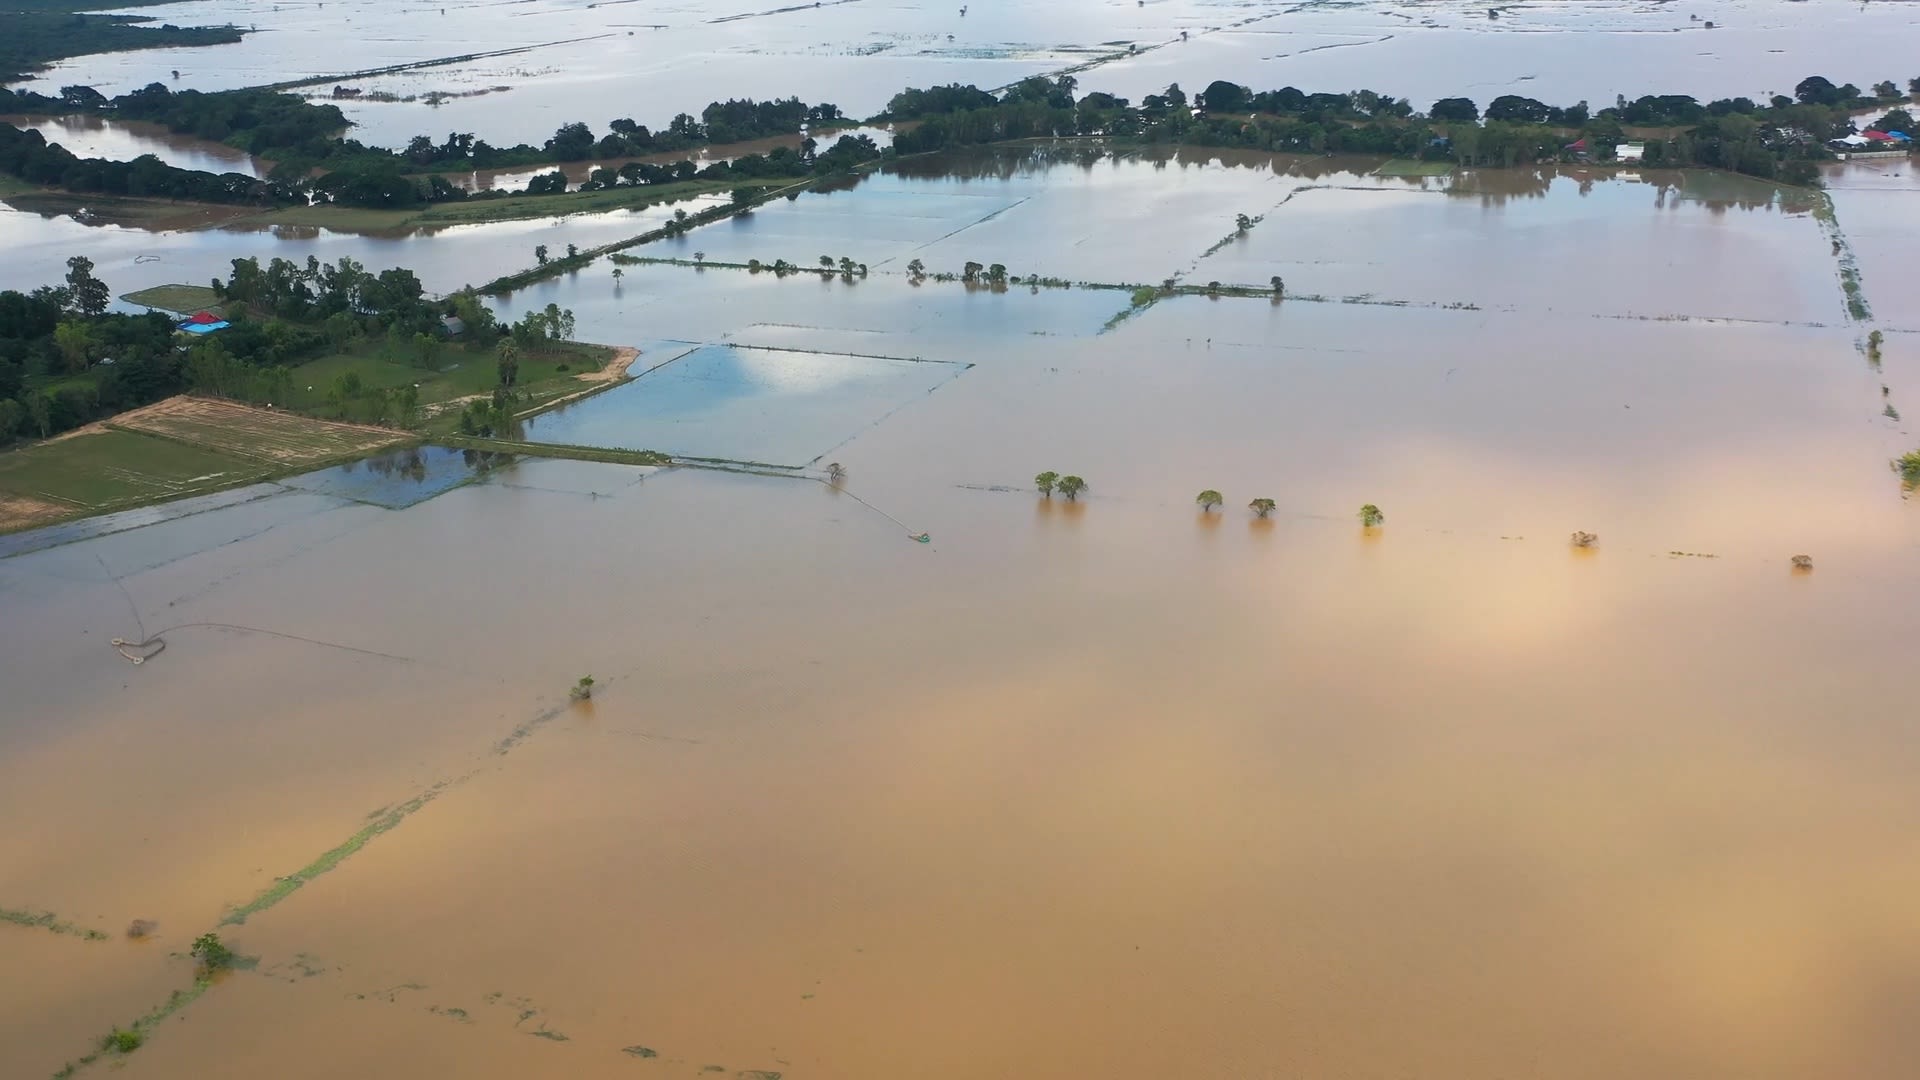
Research suggests the frequency and severity of extreme weather events including droughts, flooding and heatwaves will increase over the next century. Regions that suffer disproportionately from these impacts of climate change are often those with lower socioeconomic development, and more at risk of food insecurity. Some regions, however, may benefit from the changing climate.

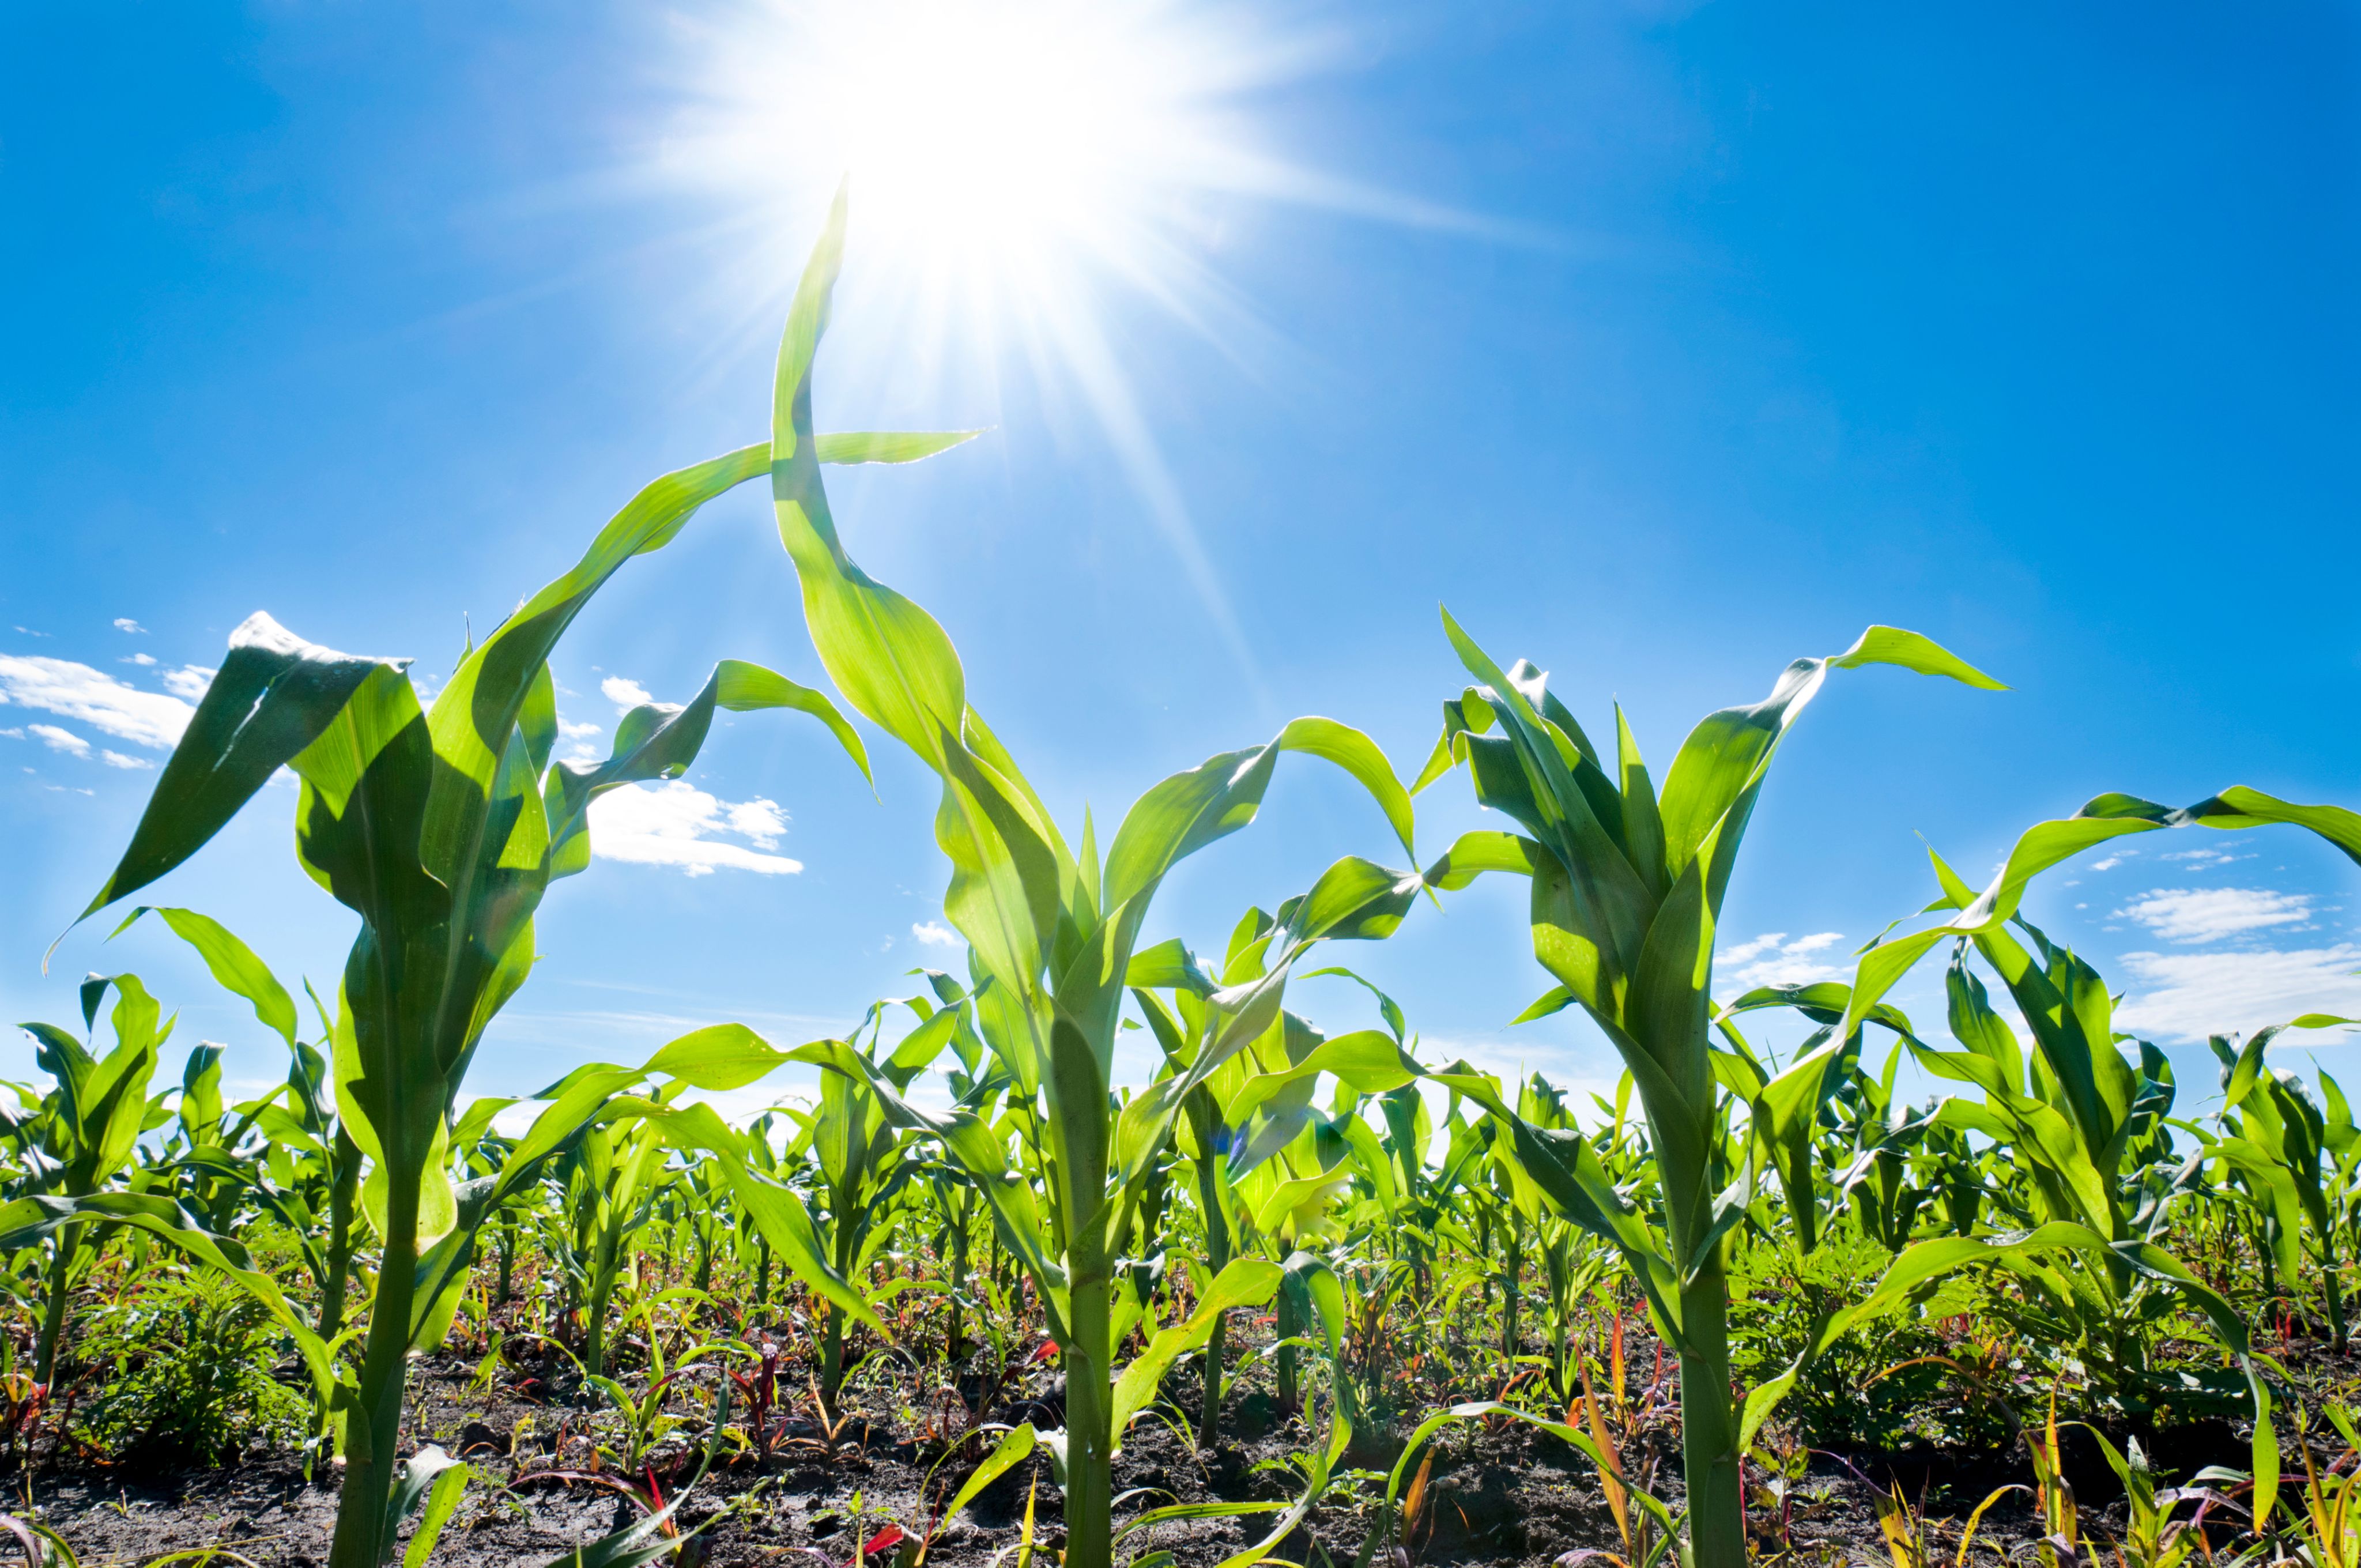
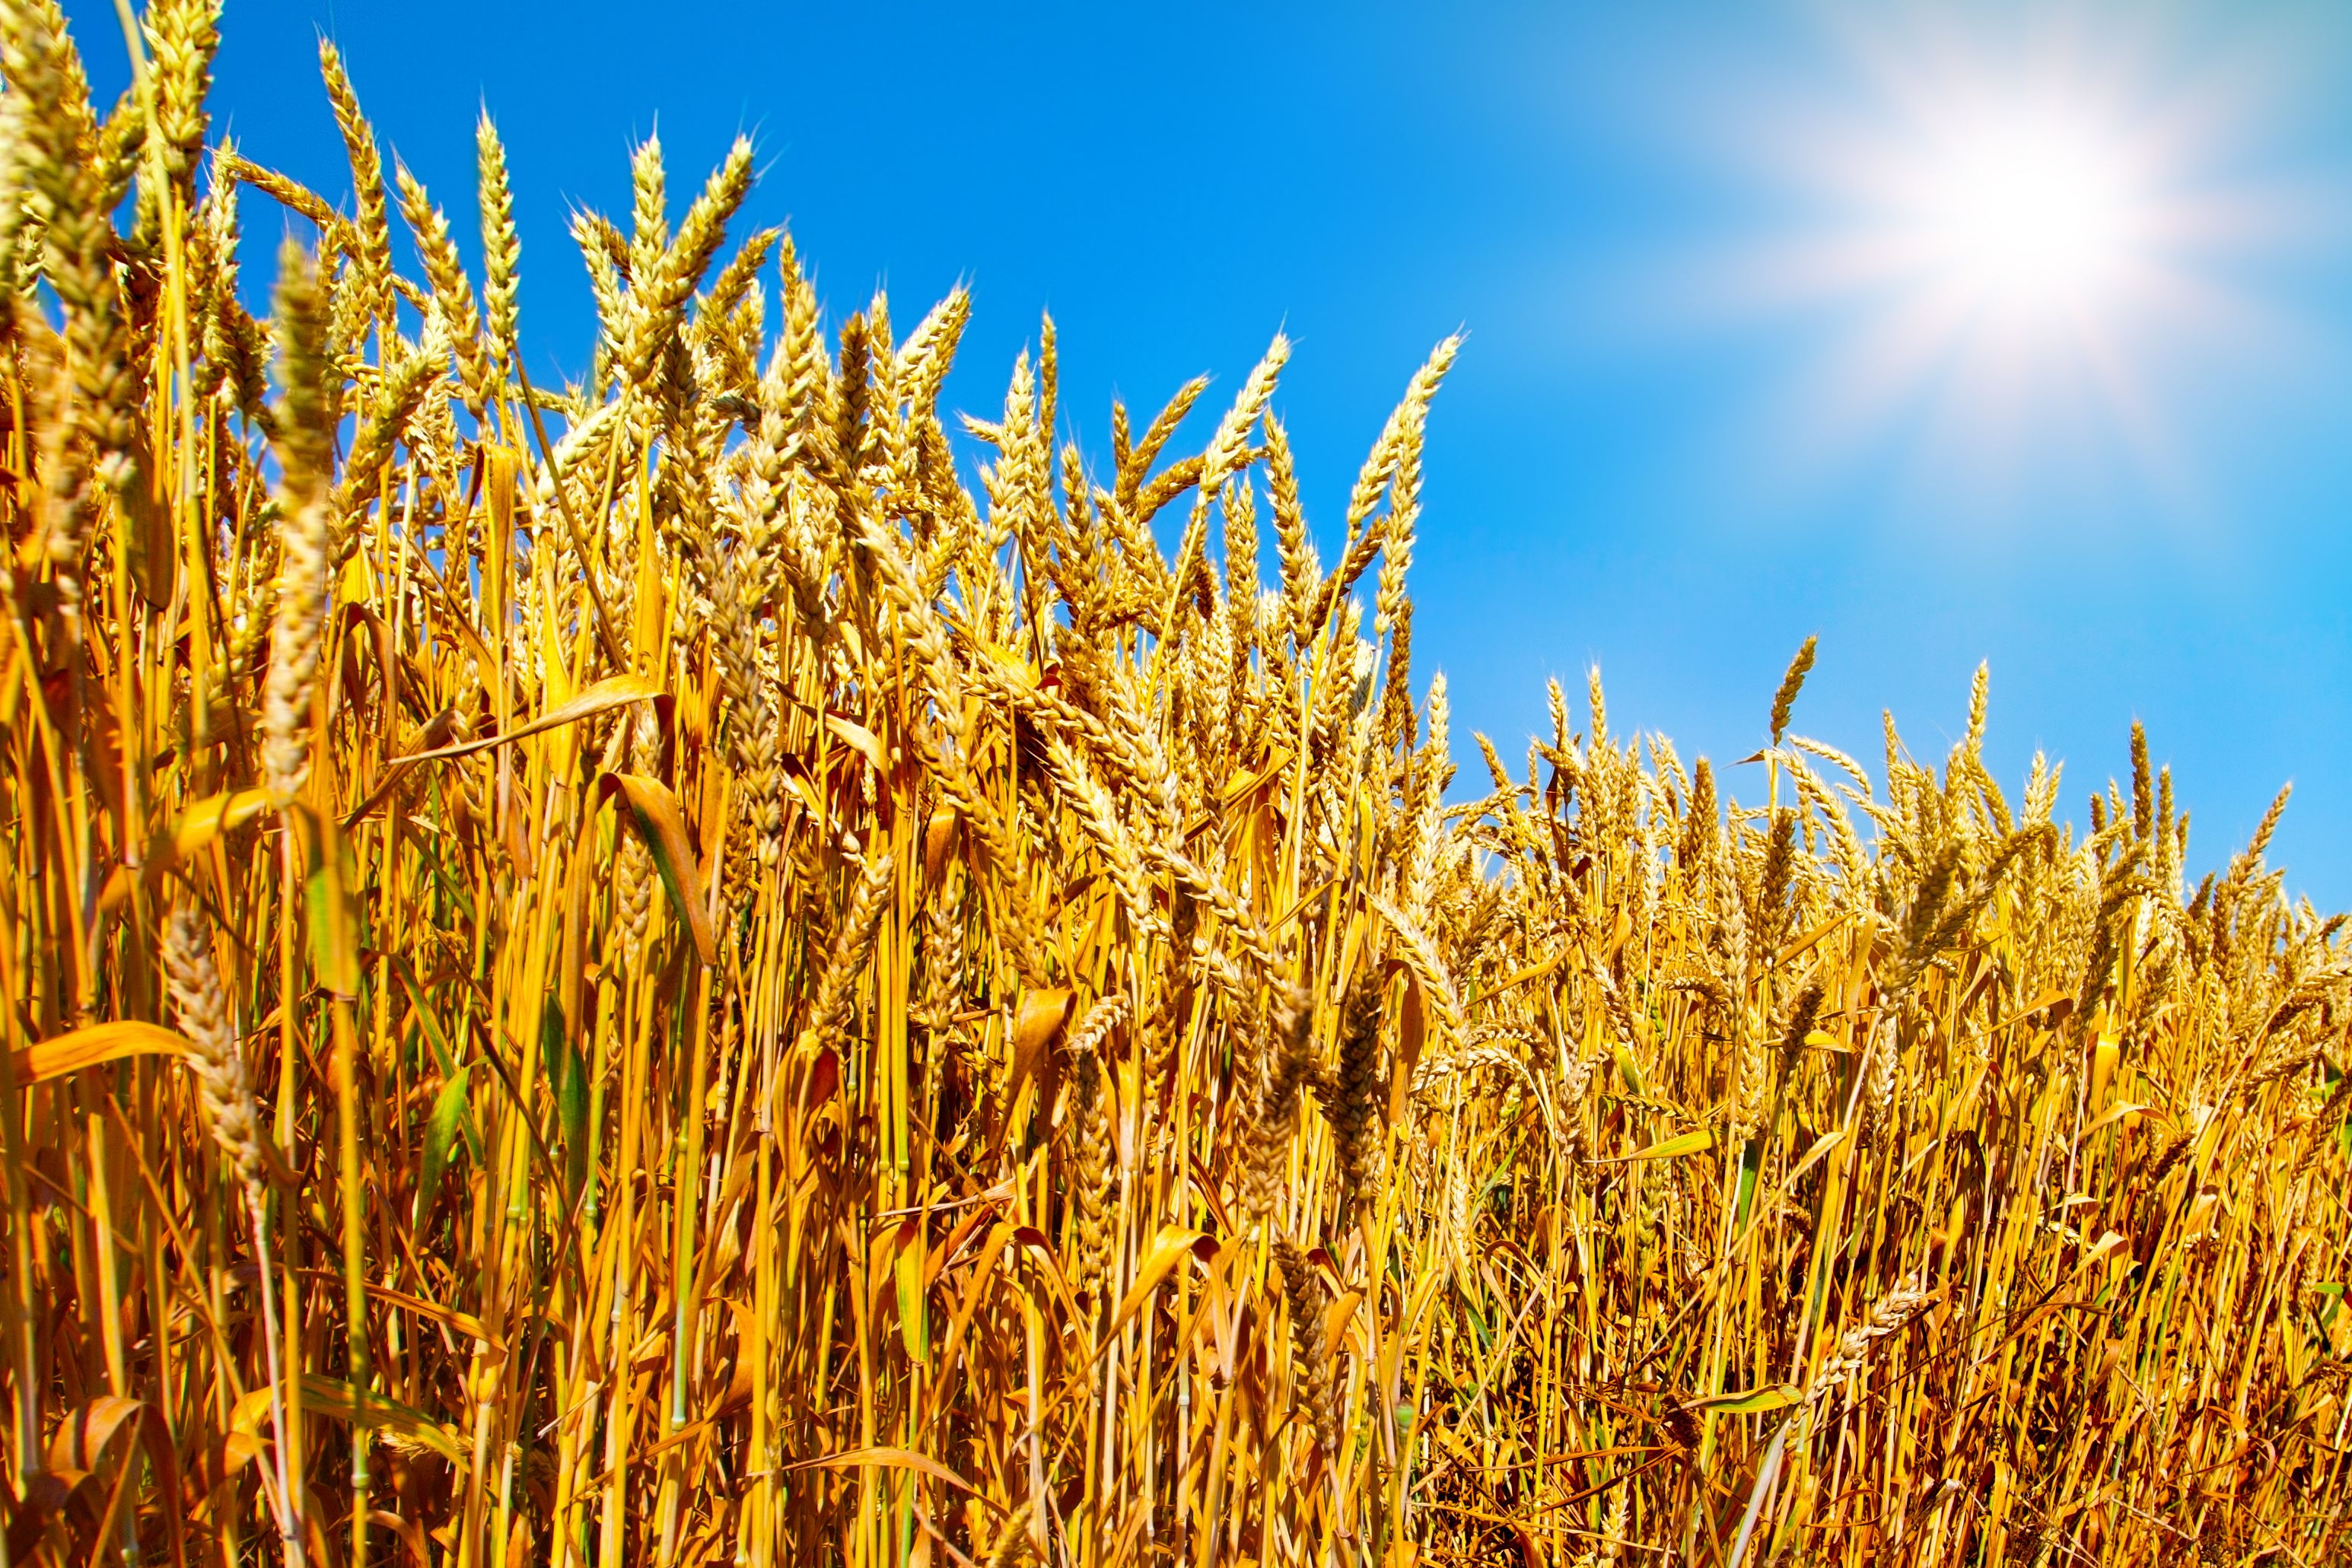
The effects of climate change on crop yields varies depending on the crop and its location. In many lower-latitude regions, crops like maize and wheat have suffered from environmental changes, while in regions further from the equator, they have benefited. Production areas will shift to follow favourable climate conditions, and the composition of croplands is likely to change over time as a result.

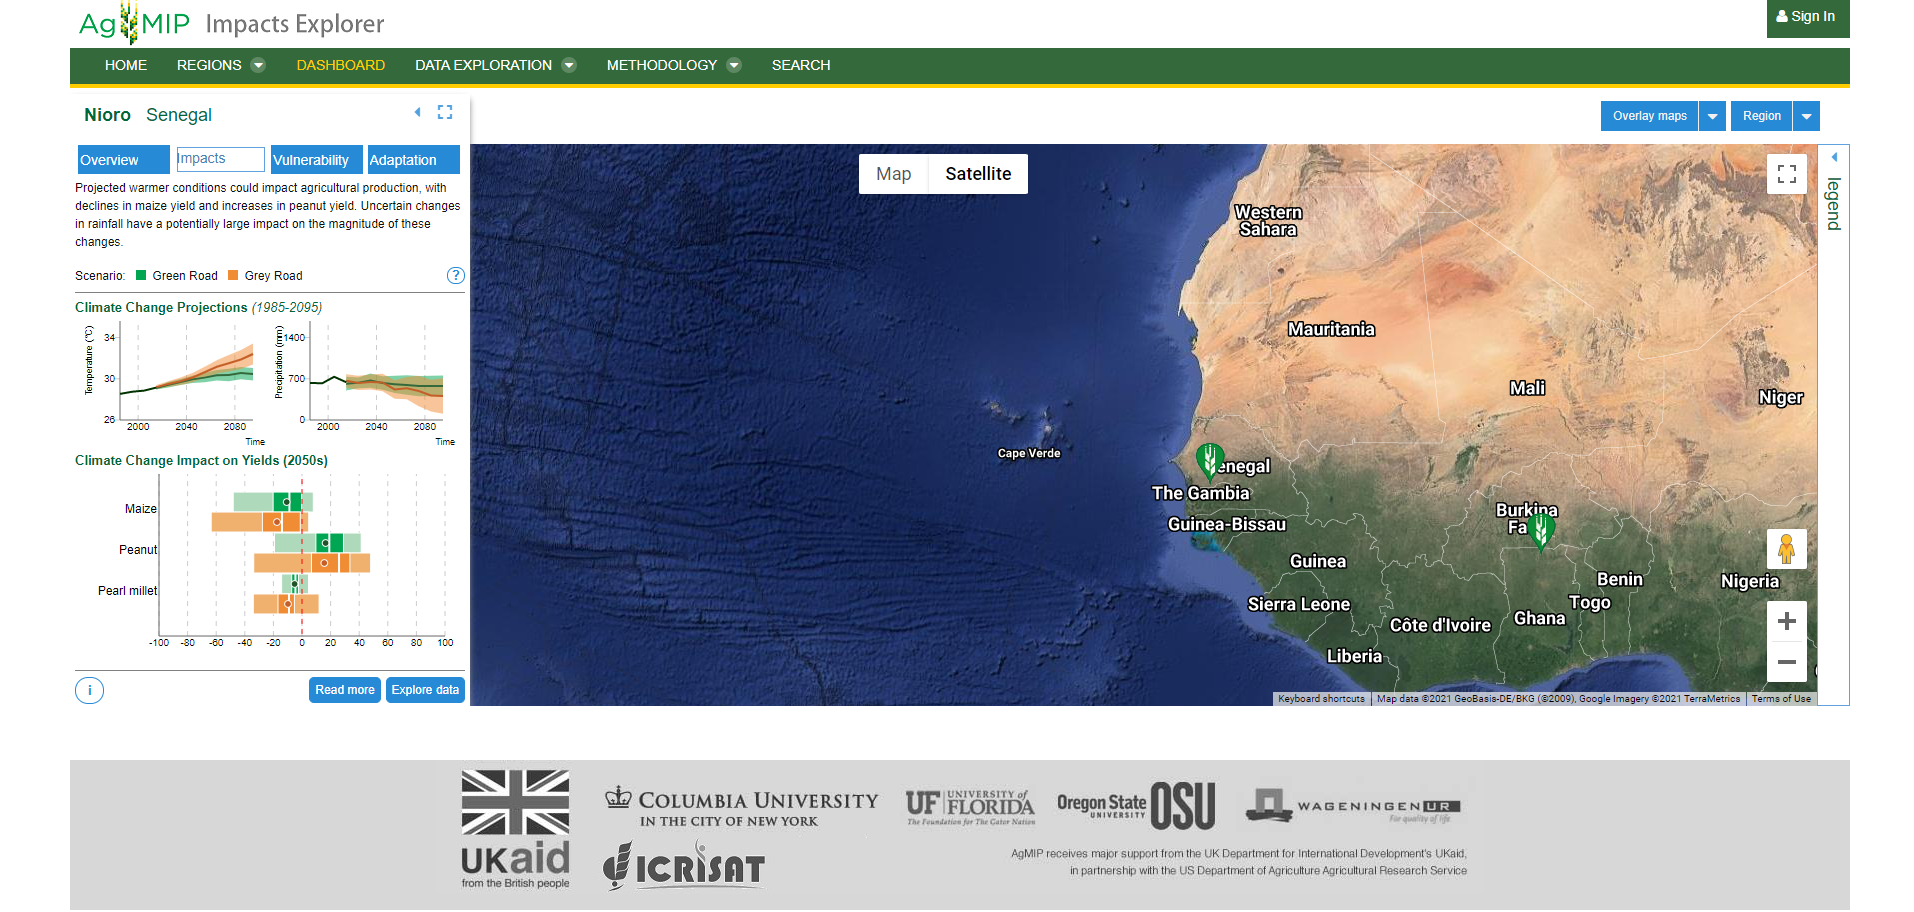
Climate change impact on yields by 2050 in Senegal. Credit: Wageningen University & Research.
Climate change impact on yields by 2050 in Senegal. Credit: Wageningen University & Research.
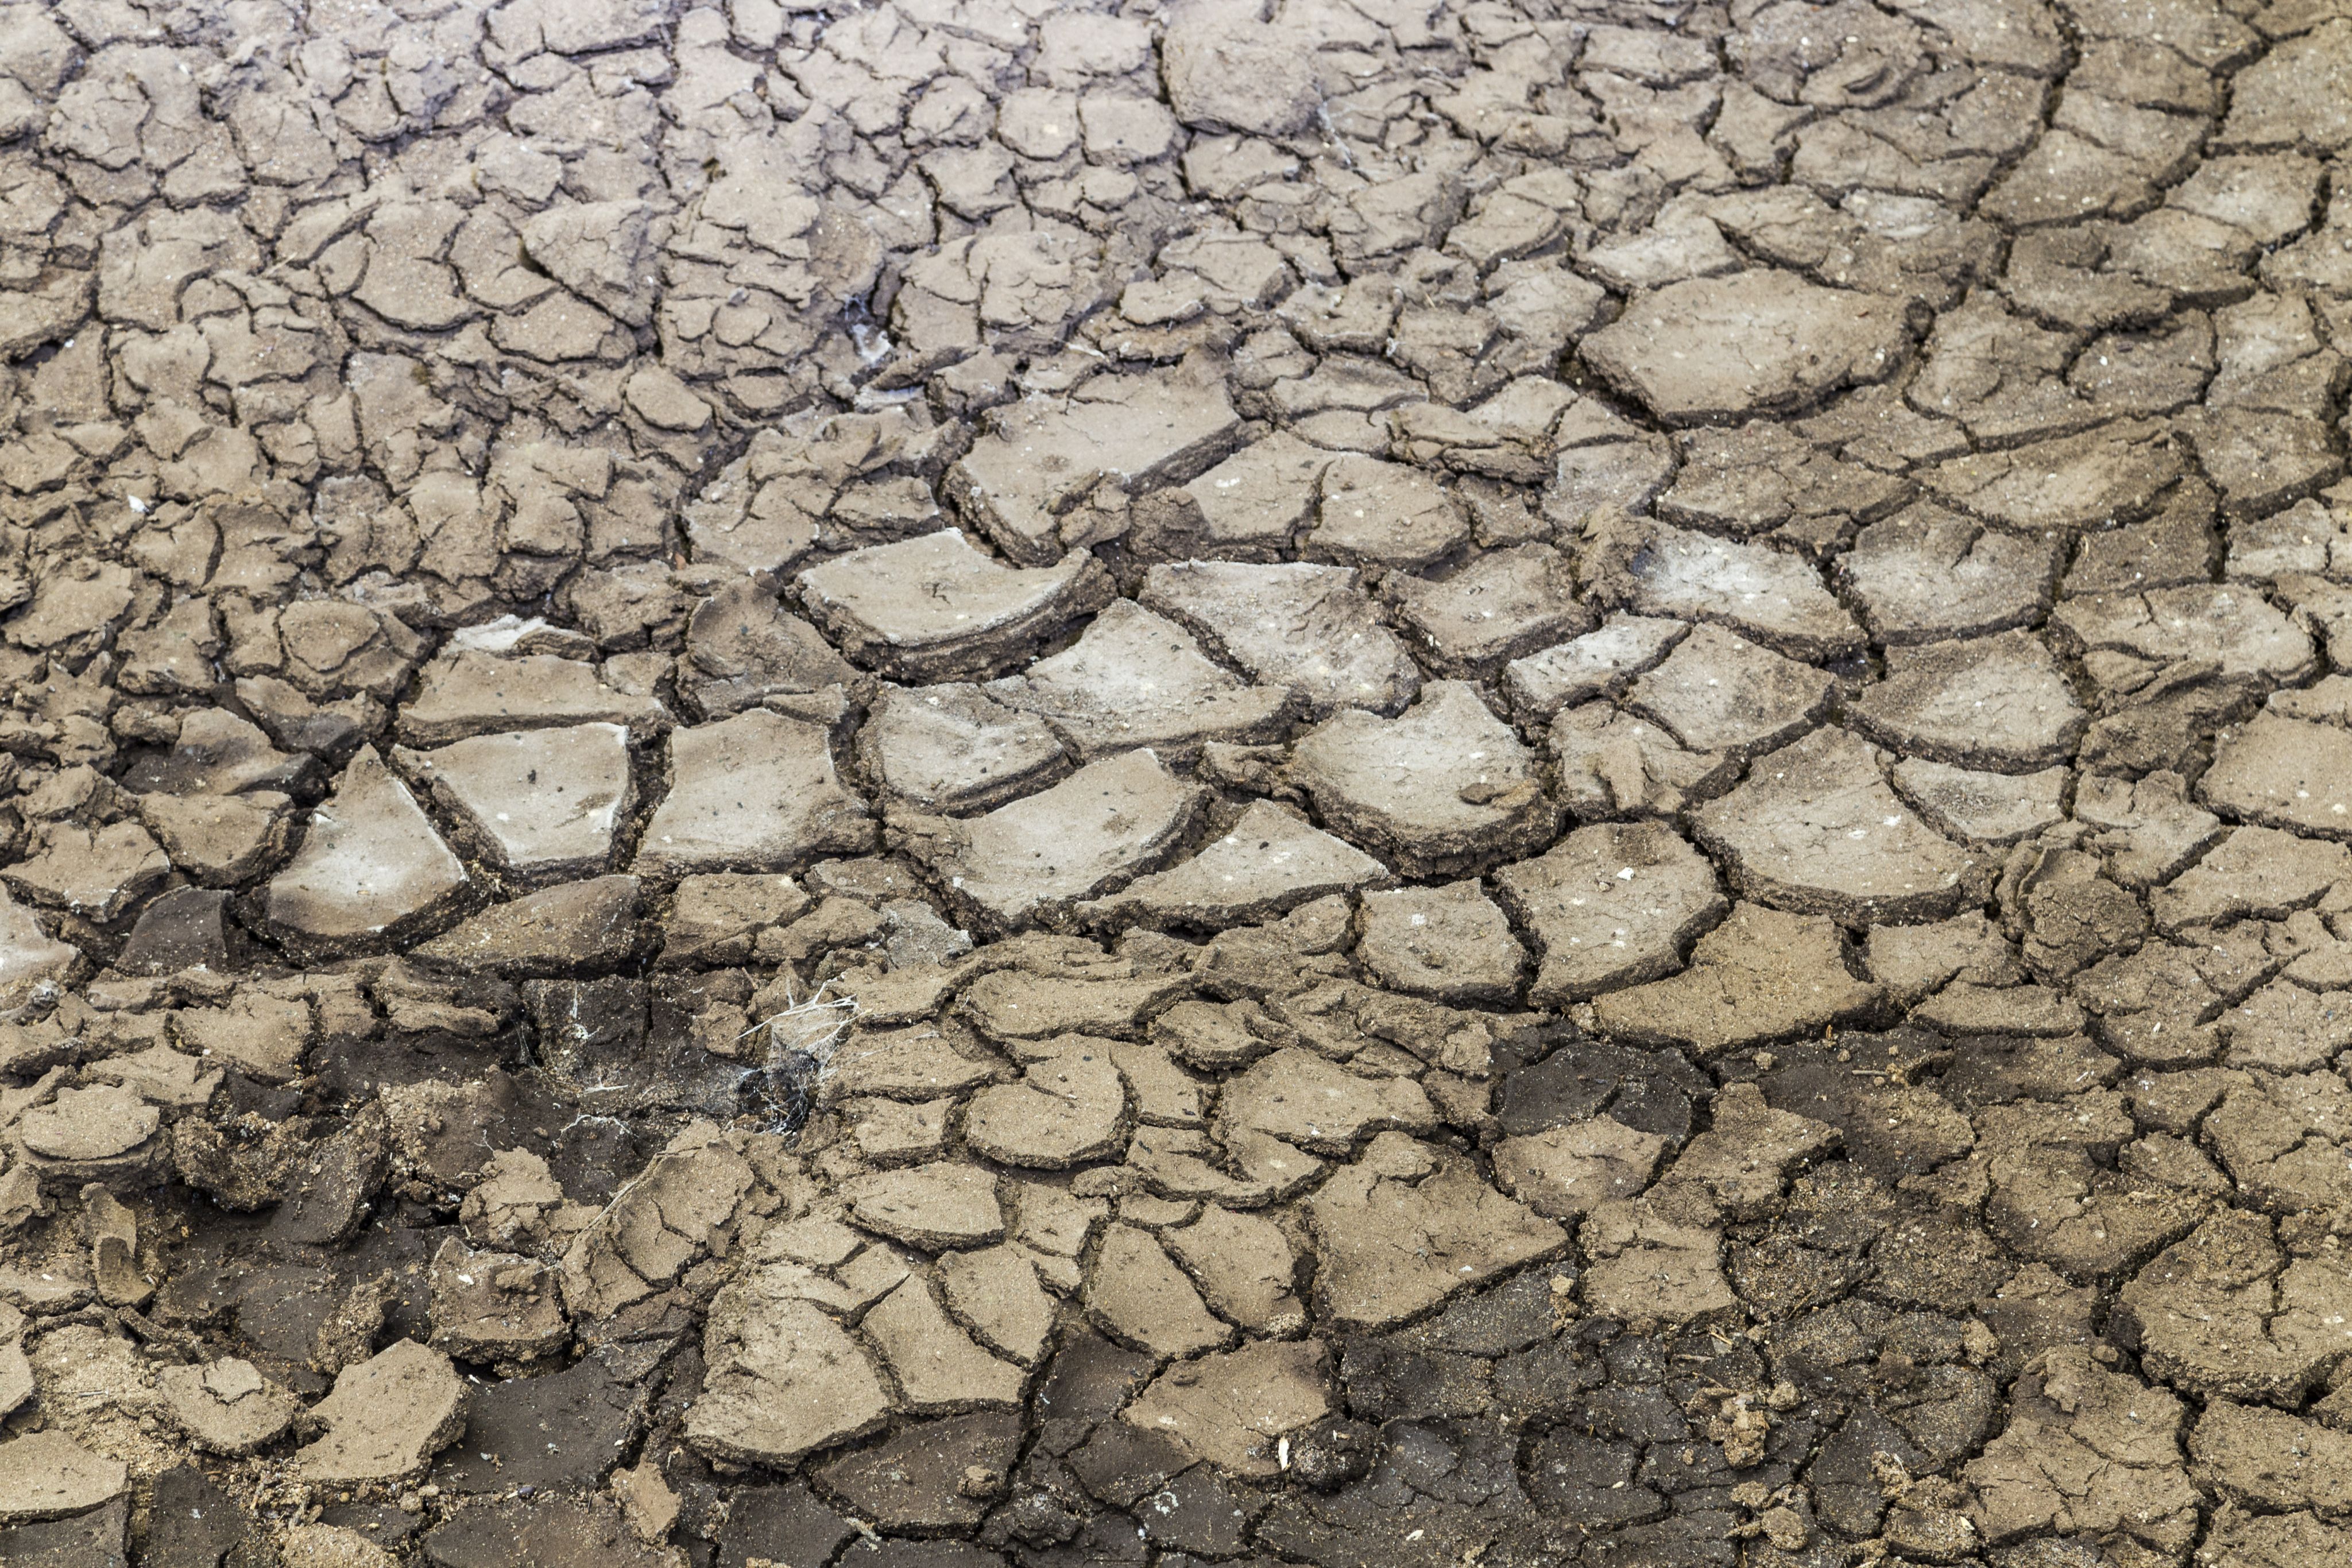
Extreme weather events may also impact crop yields. For example, warming and drying have devastated yields in parts of the Mediterranean.
Ambitions to limit global warming to 2°C or even 1.5°C above pre-industrial temperatures could also lead to additional pressures from land-based mitigation measures such as bioenergy production and afforestation.

Understanding, monitoring and adapting to these complex shifts will be key to a future of sustainable food.
As well as being hit by the evolving climate, agriculture is a major contributor to greenhouse gas emissions, and human-driven climate change. Land use patterns will need to change and adapt to keep productivity high while bringing down the industry’s carbon footprint.

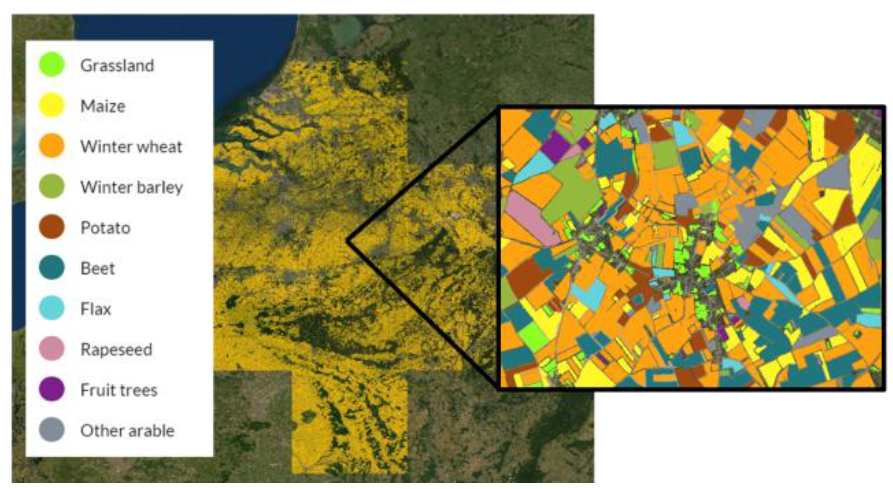
Classifying crop types in Belgium and the Netherlands based on an image from the Copernicus Sentinel-2 satellite. Credit: Wageningen University & Research.
Classifying crop types in Belgium and the Netherlands based on an image from the Copernicus Sentinel-2 satellite. Credit: Wageningen University & Research.
For analysing growing conditions and planning ahead, agriculture professionals need detailed maps to estimate crop cover and monitor crop production.
But creating such maps at a global scale is challenging. Landscape dynamics, growing seasons, agricultural management practices and crop types all vary enormously around the world.
Populating the maps also depends on the availability of high-quality, regularly updated data. Despite several attempts to create global maps, these have all fallen short of the required spatial detail, accuracy or timeliness.
The agricultural community needs a new system; one that is accessible, detailed and adaptable to varying cropland regions around the world.
Making data more accessible
for the agriculture sector
C3S’ ERA5 dataset contains key information about the climate of the last few decades that could in theory be useful for the agriculture sector to plan for the future.
ERA5 can be processed to make it even more useful to specific sectors. However, this complex and specialised task can present a barrier to many key interest groups in the agricultural industry, as well as to technical policymakers, information agencies, NGOs and insurance providers.
To solve this challenge Wageningen University & Research processed ERA5 data into a meaningful, accessible dataset to be used in agricultural and agro-ecological modelling. They compiled ERA5 data into easier-to-handle daily time steps, using local time zone definitions. In this way, they lowered the barrier to using C3S climate data.
“We think it’s very relevant to inform agricultural scientists, but also agricultural businesses, consultancy firms, data providers, information services and also the agricultural policy community, about what is coming up through a combination of value-added products”
Ronald Hutjes, Wageningen University & Research


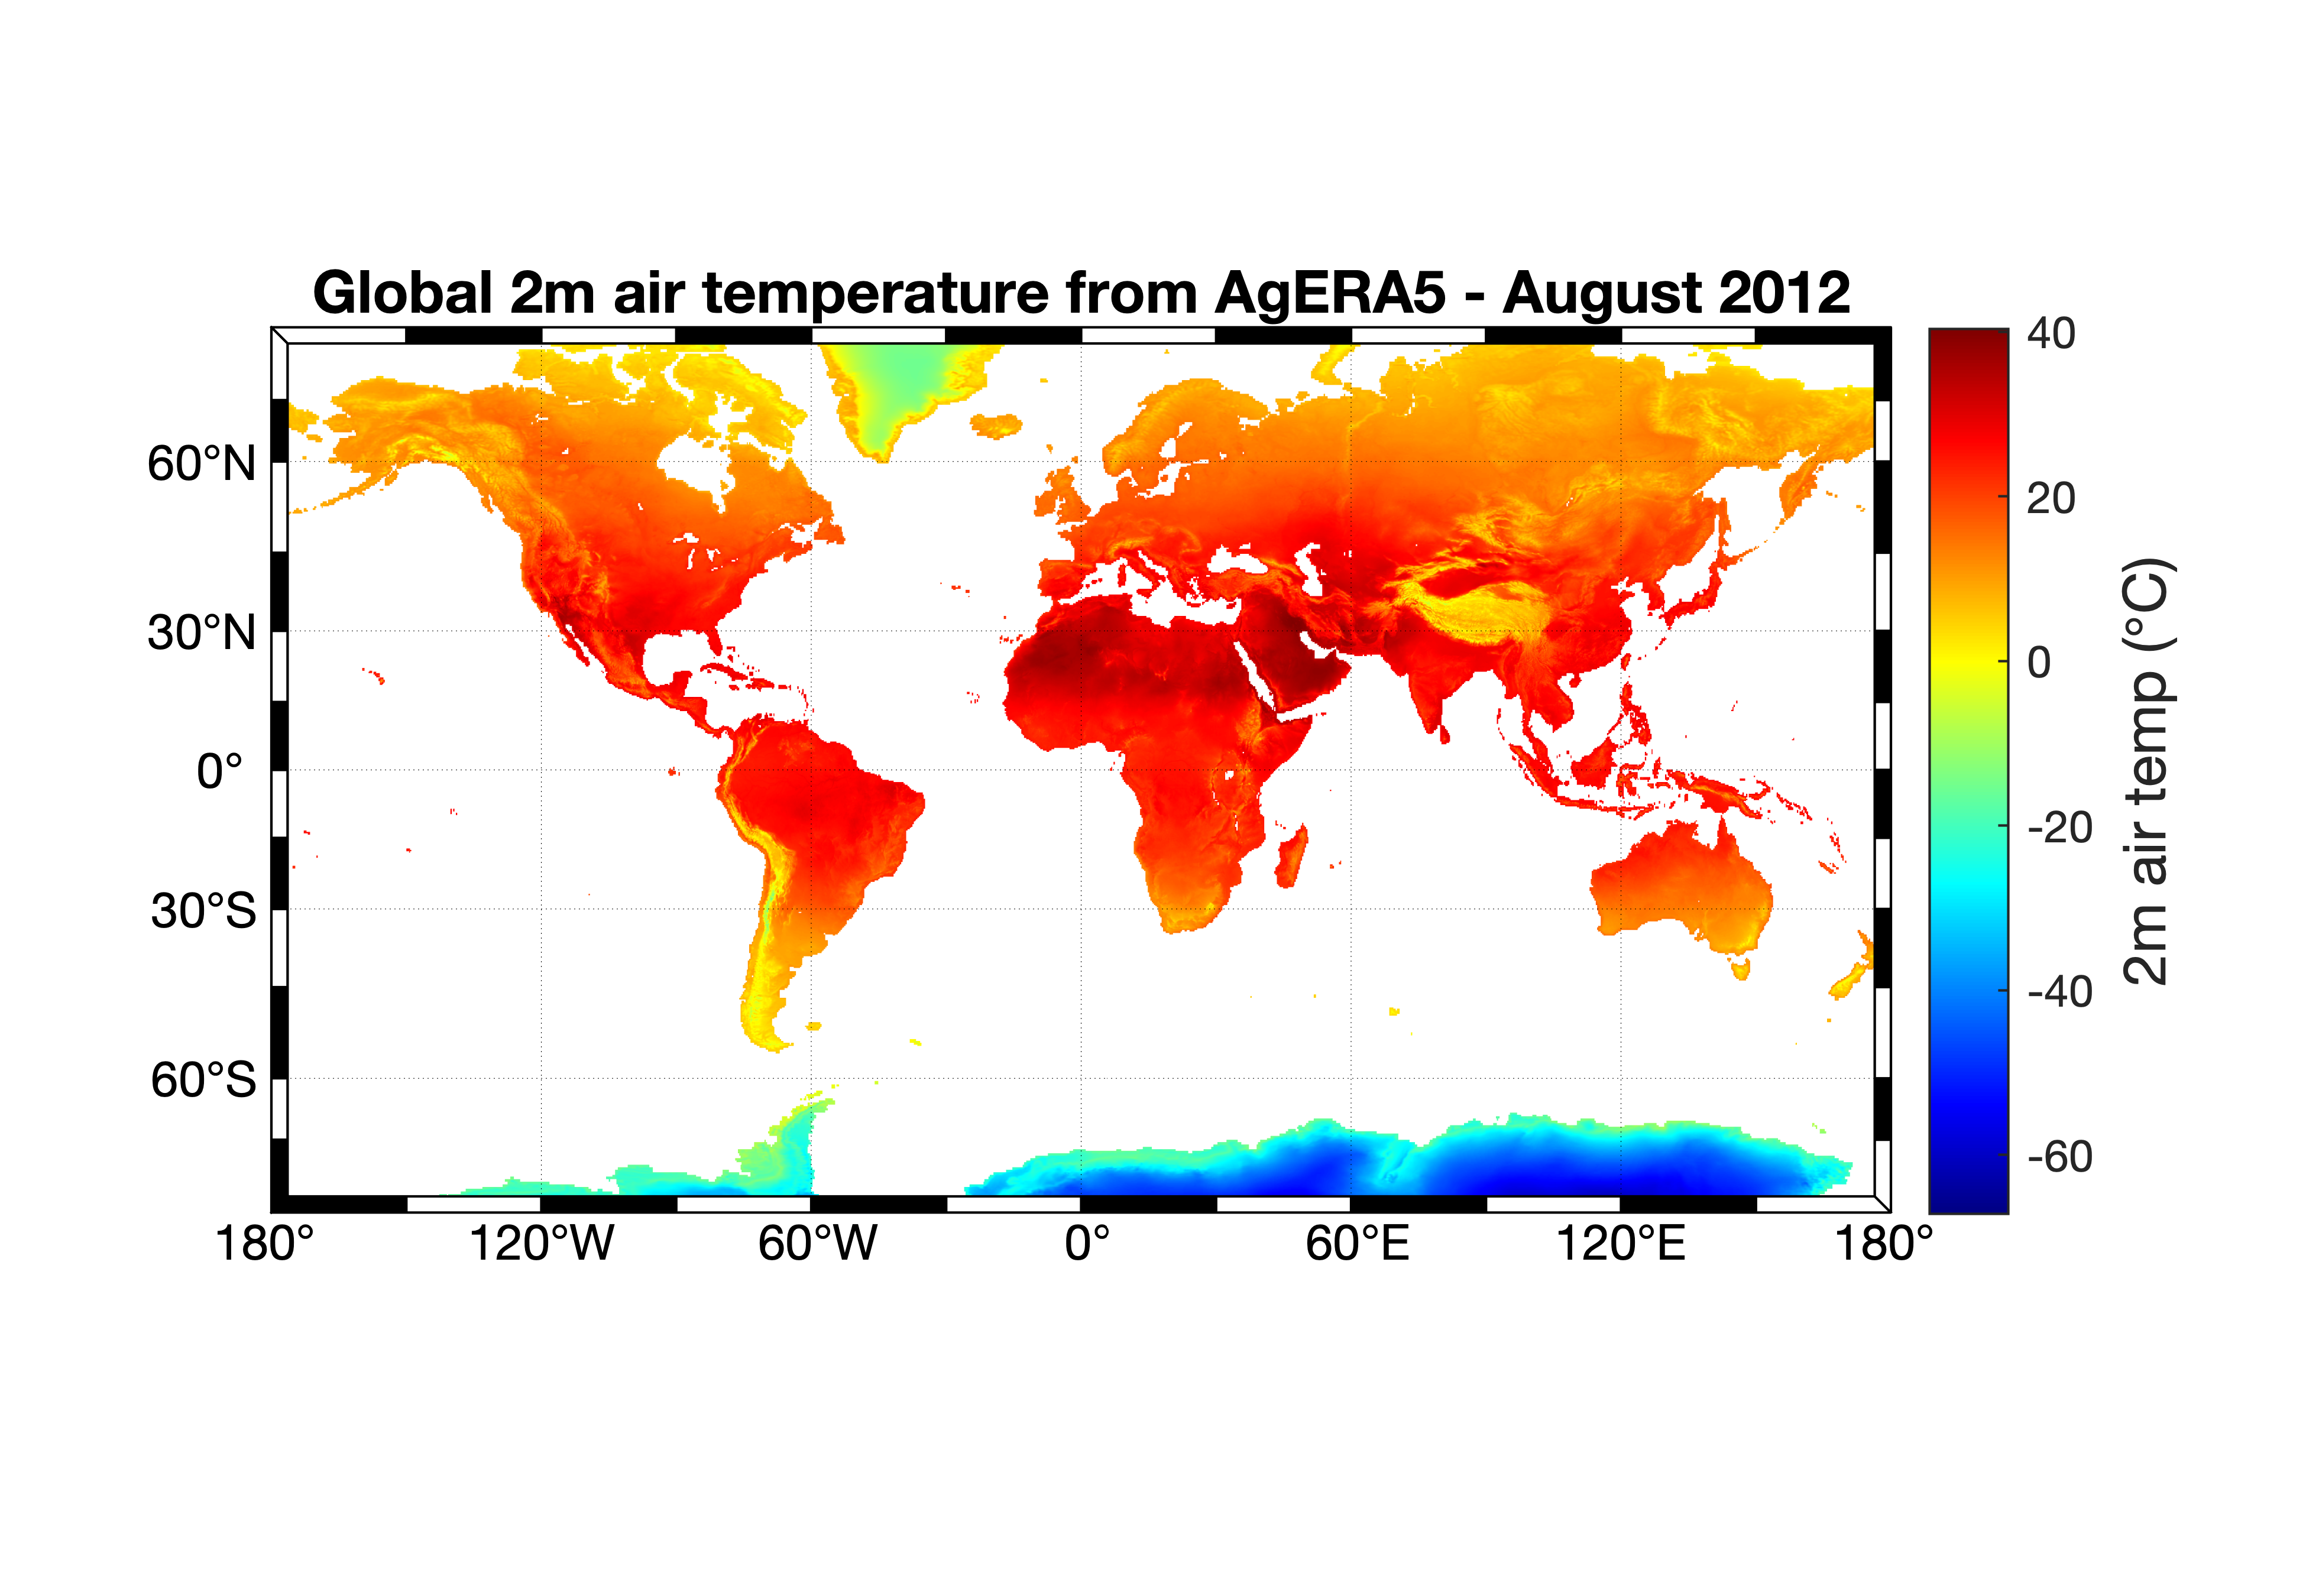
Global 2 metre air temperature derived from the AgERA5 dataset, averaged for August 2012. Credit: Copernicus Climate Change Service, ECMWF.
Global 2 metre air temperature derived from the AgERA5 dataset, averaged for August 2012. Credit: Copernicus Climate Change Service, ECMWF.
The new tailored dataset – ‘Agrometeorological indicators from 1979 to present derived from reanalysis’ (AgERA5) – offers climate information covering the past four decades that is relevant for agricultural modelling. The dataset includes information on temperature, humidity, precipitation, snow thickness, solar radiation, cloud cover and dew point for the entire world.
These variables are offered at a high spatial resolution, which allows the agriculture sector to see how agriculture is being affected by climate change at a more local scale, and thus helps users to plan better for the future.
AgERA5 serves as a single entry point for the agriculture community to access climate data for agricultural modelling and map creation. It avoids a potential proliferation of lower-quality datasets in the industry, and will not only save users money but may even stimulate new agriculture and food security projects.
The WorldCereal project, and other of cropland maps producers, can directly use AgERA5 in their modelling, rather than transforming ERA5 data to their own specific needs each time.

WorldCereal is an Earth Observation based system for timely global crop monitoring at field scale. Credit: ESA.
WorldCereal is an Earth Observation based system for timely global crop monitoring at field scale. Credit: ESA.
WorldCereal aims to develop an efficient, agile and robust Earth observation-based system for timely global crop monitoring which can be applied to individual fields. The project hopes to engage the agricultural community to increase the productivity of global food production and secure the world’s food supplies.
By 2022, WorldCereal expects to be producing annual cropland maps at a resolution of 10 metres that are updated on a seasonal basis using climate, terrain and vegetation data. High-quality cropland maps can show how production zones are moving, which is important for keeping track of in-season crop productivity. They can also help with cycling crops to increase annual yields.
To generate cropland maps, WorldCereal is using a suite of algorithms fed with a combination of data on the climate (from AgERA5) and on vegetation (from satellites such as the Copernicus Sentinels). By producing the AgERA5 dataset, this case study has enabled WorldCereal to spend more time focusing on other parts of the map creation process.

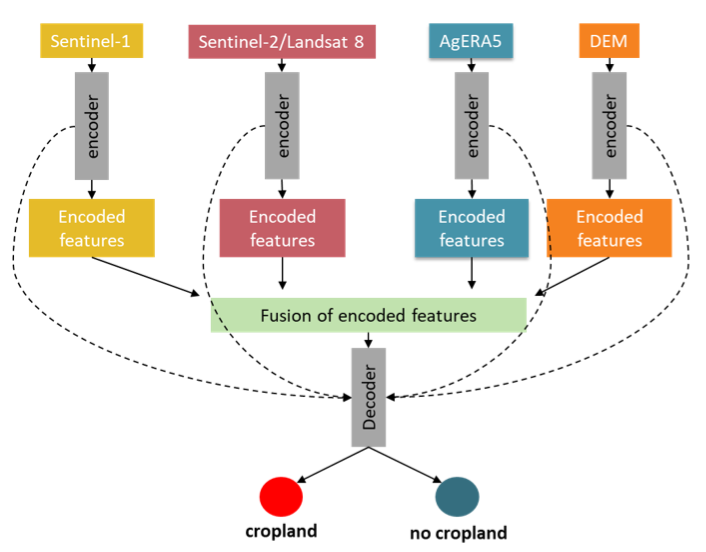
WorldCereal generates cropland maps by using a suite of algorithms fed with a combination of data on the climate from the AgERA5 dataset and on vegetation from satellites. Credit: ESA.
WorldCereal generates cropland maps by using a suite of algorithms fed with a combination of data on the climate from the AgERA5 dataset and on vegetation from satellites. Credit: ESA.
AgERA5 is being used to train WorldCereal’s cropland classification algorithms. For example, the AgERA5 temperature and precipitation variables help identify where cropland are not likely to occur.
AgERA5 has already proved itself to be especially useful in areas where precipitation and temperature are the main determinants of whether land is suitable for various crop types.

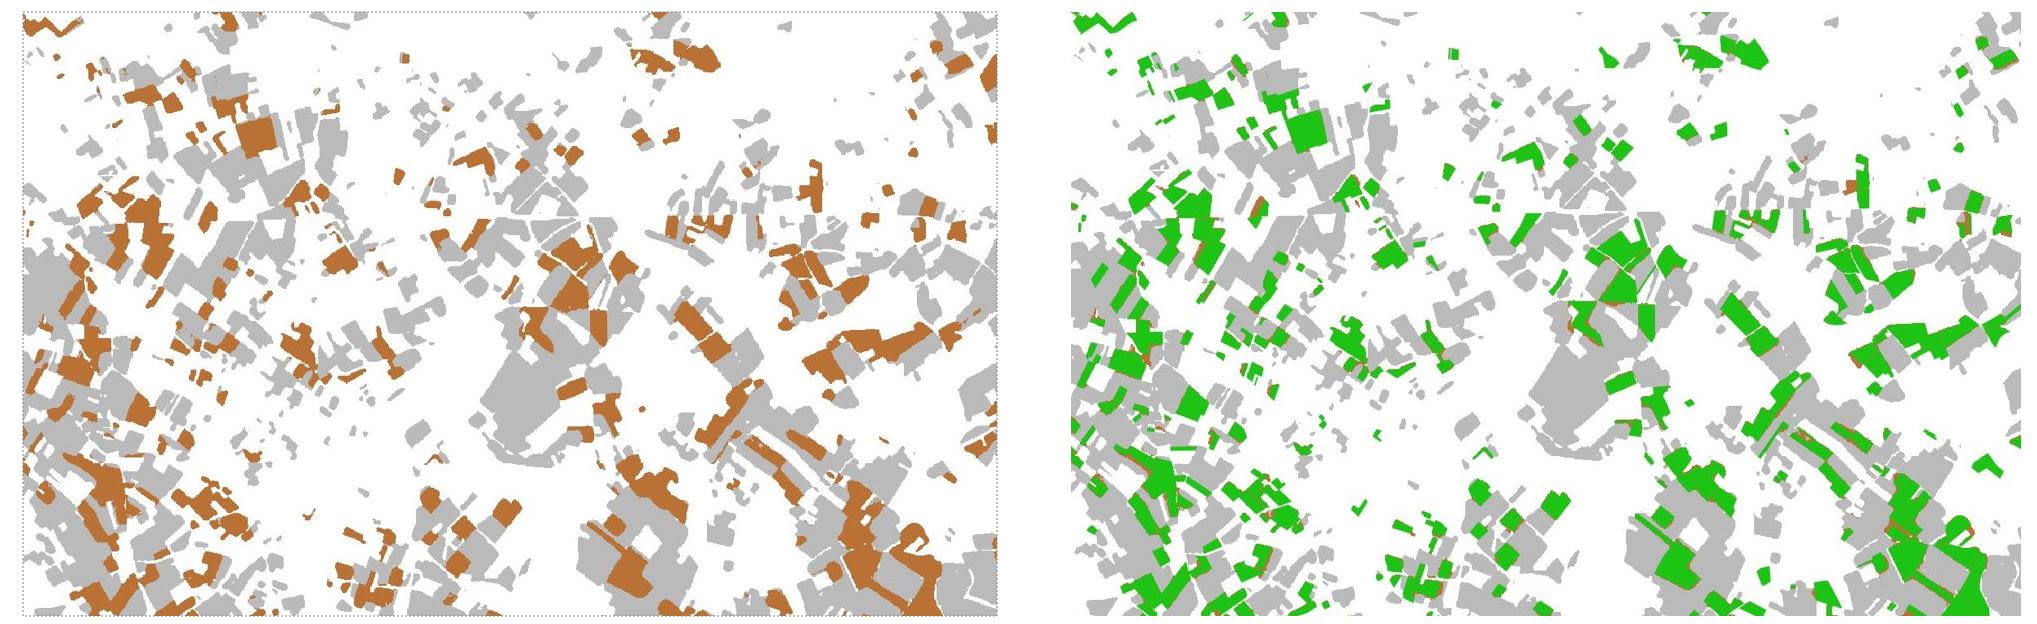
An example of classified winter wheat in Belgium from land-parcel identification system (left) and a reference validation set (right) from the WorldCereal project. Credit: ESA.
An example of classified winter wheat in Belgium from land-parcel identification system (left) and a reference validation set (right) from the WorldCereal project. Credit: ESA.
The International Maize and Wheat Improvement Centre (CIMMYT) envisions a world with more resilient agri-food systems. By combining observations on plant health and development with climate data from C3S, CIMMYT can analyse how crops perform relative to the environments in which they grow. As a result, resilient varieties of maize and wheat, such as those resistant to drought, can be selected. CIMMYT is a discerning user of the CDS, leveraging the added value of AgERA5 to reach the following aims:
- To classify environments depending on their temperatures and precipitation levels.
- To describe crop stages depending on the amount of solar radiation crops have received.
- To better understand the effects of the environment on crop development.


A more sustainable
global agriculture industry
AgERA5 is a valuable new dataset for measuring and monitoring progress on global food security. With the new crop maps produced using the dataset, researchers, businesses, traders, NGOs and government officials will be able to monitor crop production and expected changes in food availability, perform market analyses and assess food security.
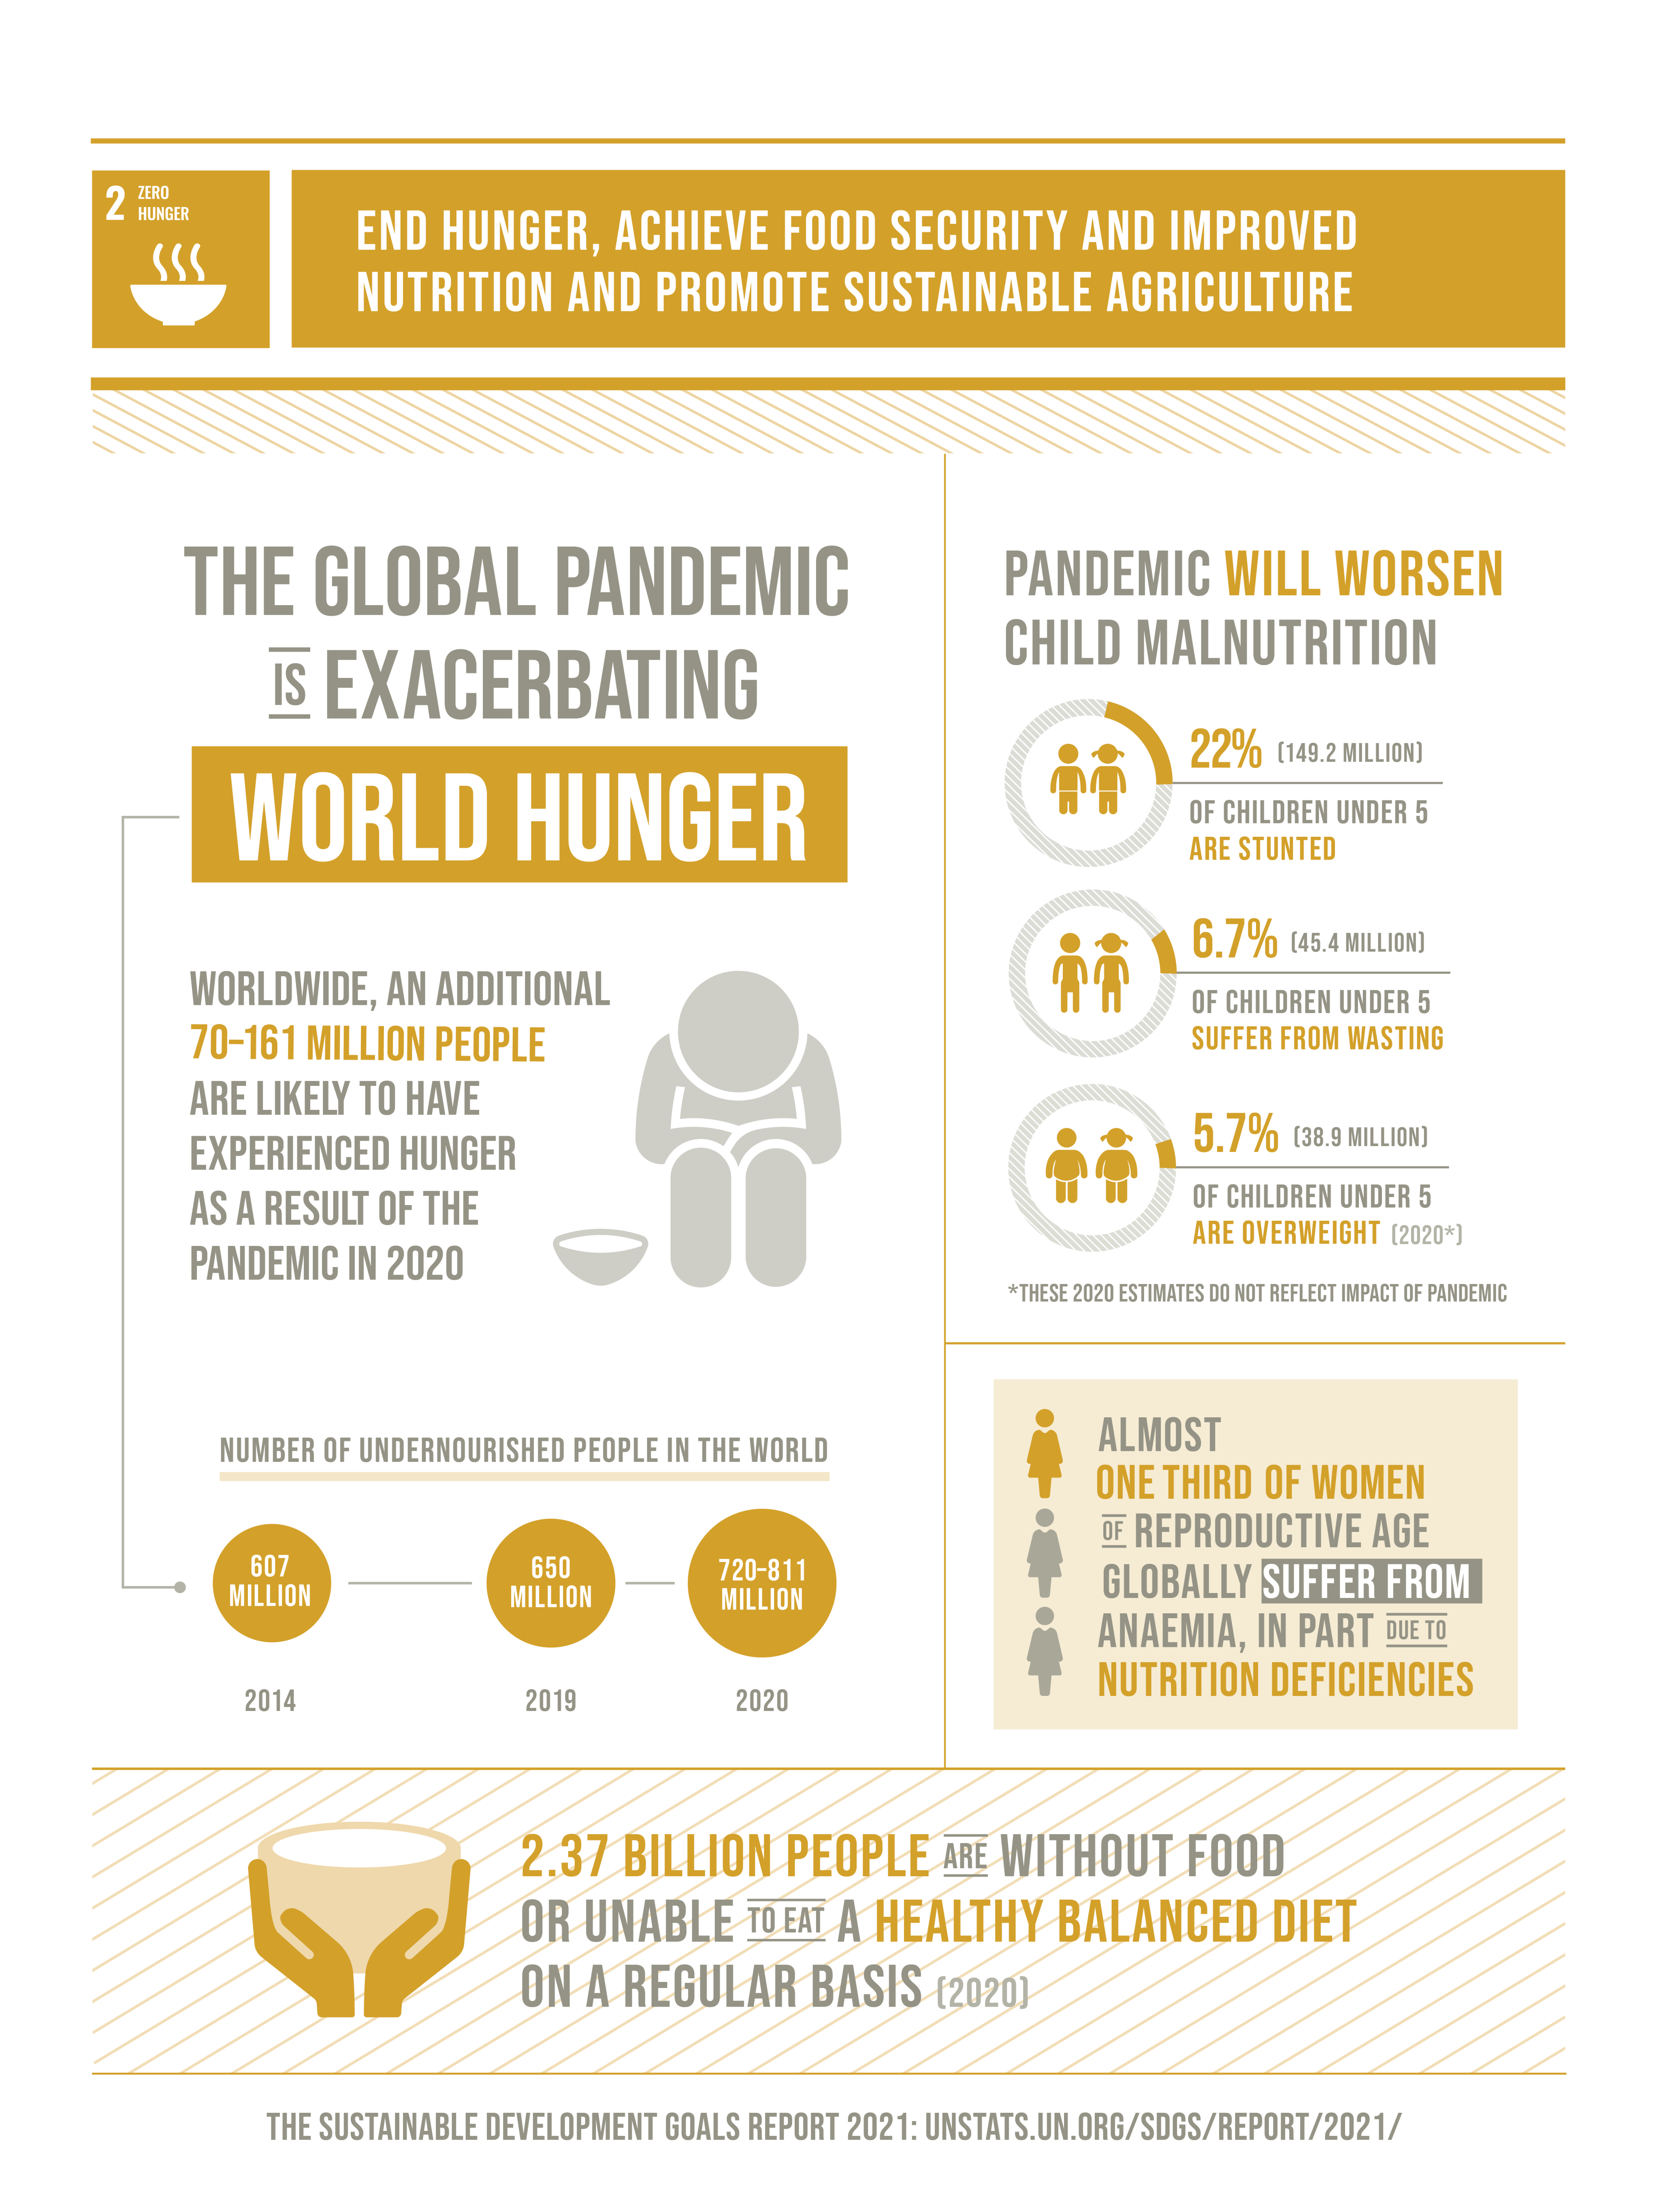
Using AgERA5 and other C3S data, global agricultural mapping initiatives can support intervention should a food crisis arise in a certain part of the world. In this way, they help to monitor progress of SDG 2 - Zero Hunger.
In particular they support SDG 2.4, which aims to increase sustainable food production. This will be achieved through improving soil and land quality and building resilience to the effects of climate change in the food production network.


SDG 12 aims to ensure responsible consumption and production patterns by 2030. At the moment, we continue to use natural resources unsustainably. Each year, an estimated one third of food produced ends up rotting in bins or spoiling due to poor transportation and harvesting practices. Land degradation and declining soil fertility are just two of the ways our food supply is impacted. By better planning agricultural practices, we can improve the ability of the land to supply us with food.
The agriculture industry contributes significantly to greenhouse gas emissions and therefore climate change. The agricultural initiatives that use AgERA5 not only can help us become more resilient to climate change – by making agriculture practices more sustainable – but they can also reduce the negative impacts of the sector on the climate. This supports SDG 13 - Climate action