
Air quality, climate change and public health
How C3S and CAMS can help protect European citizens

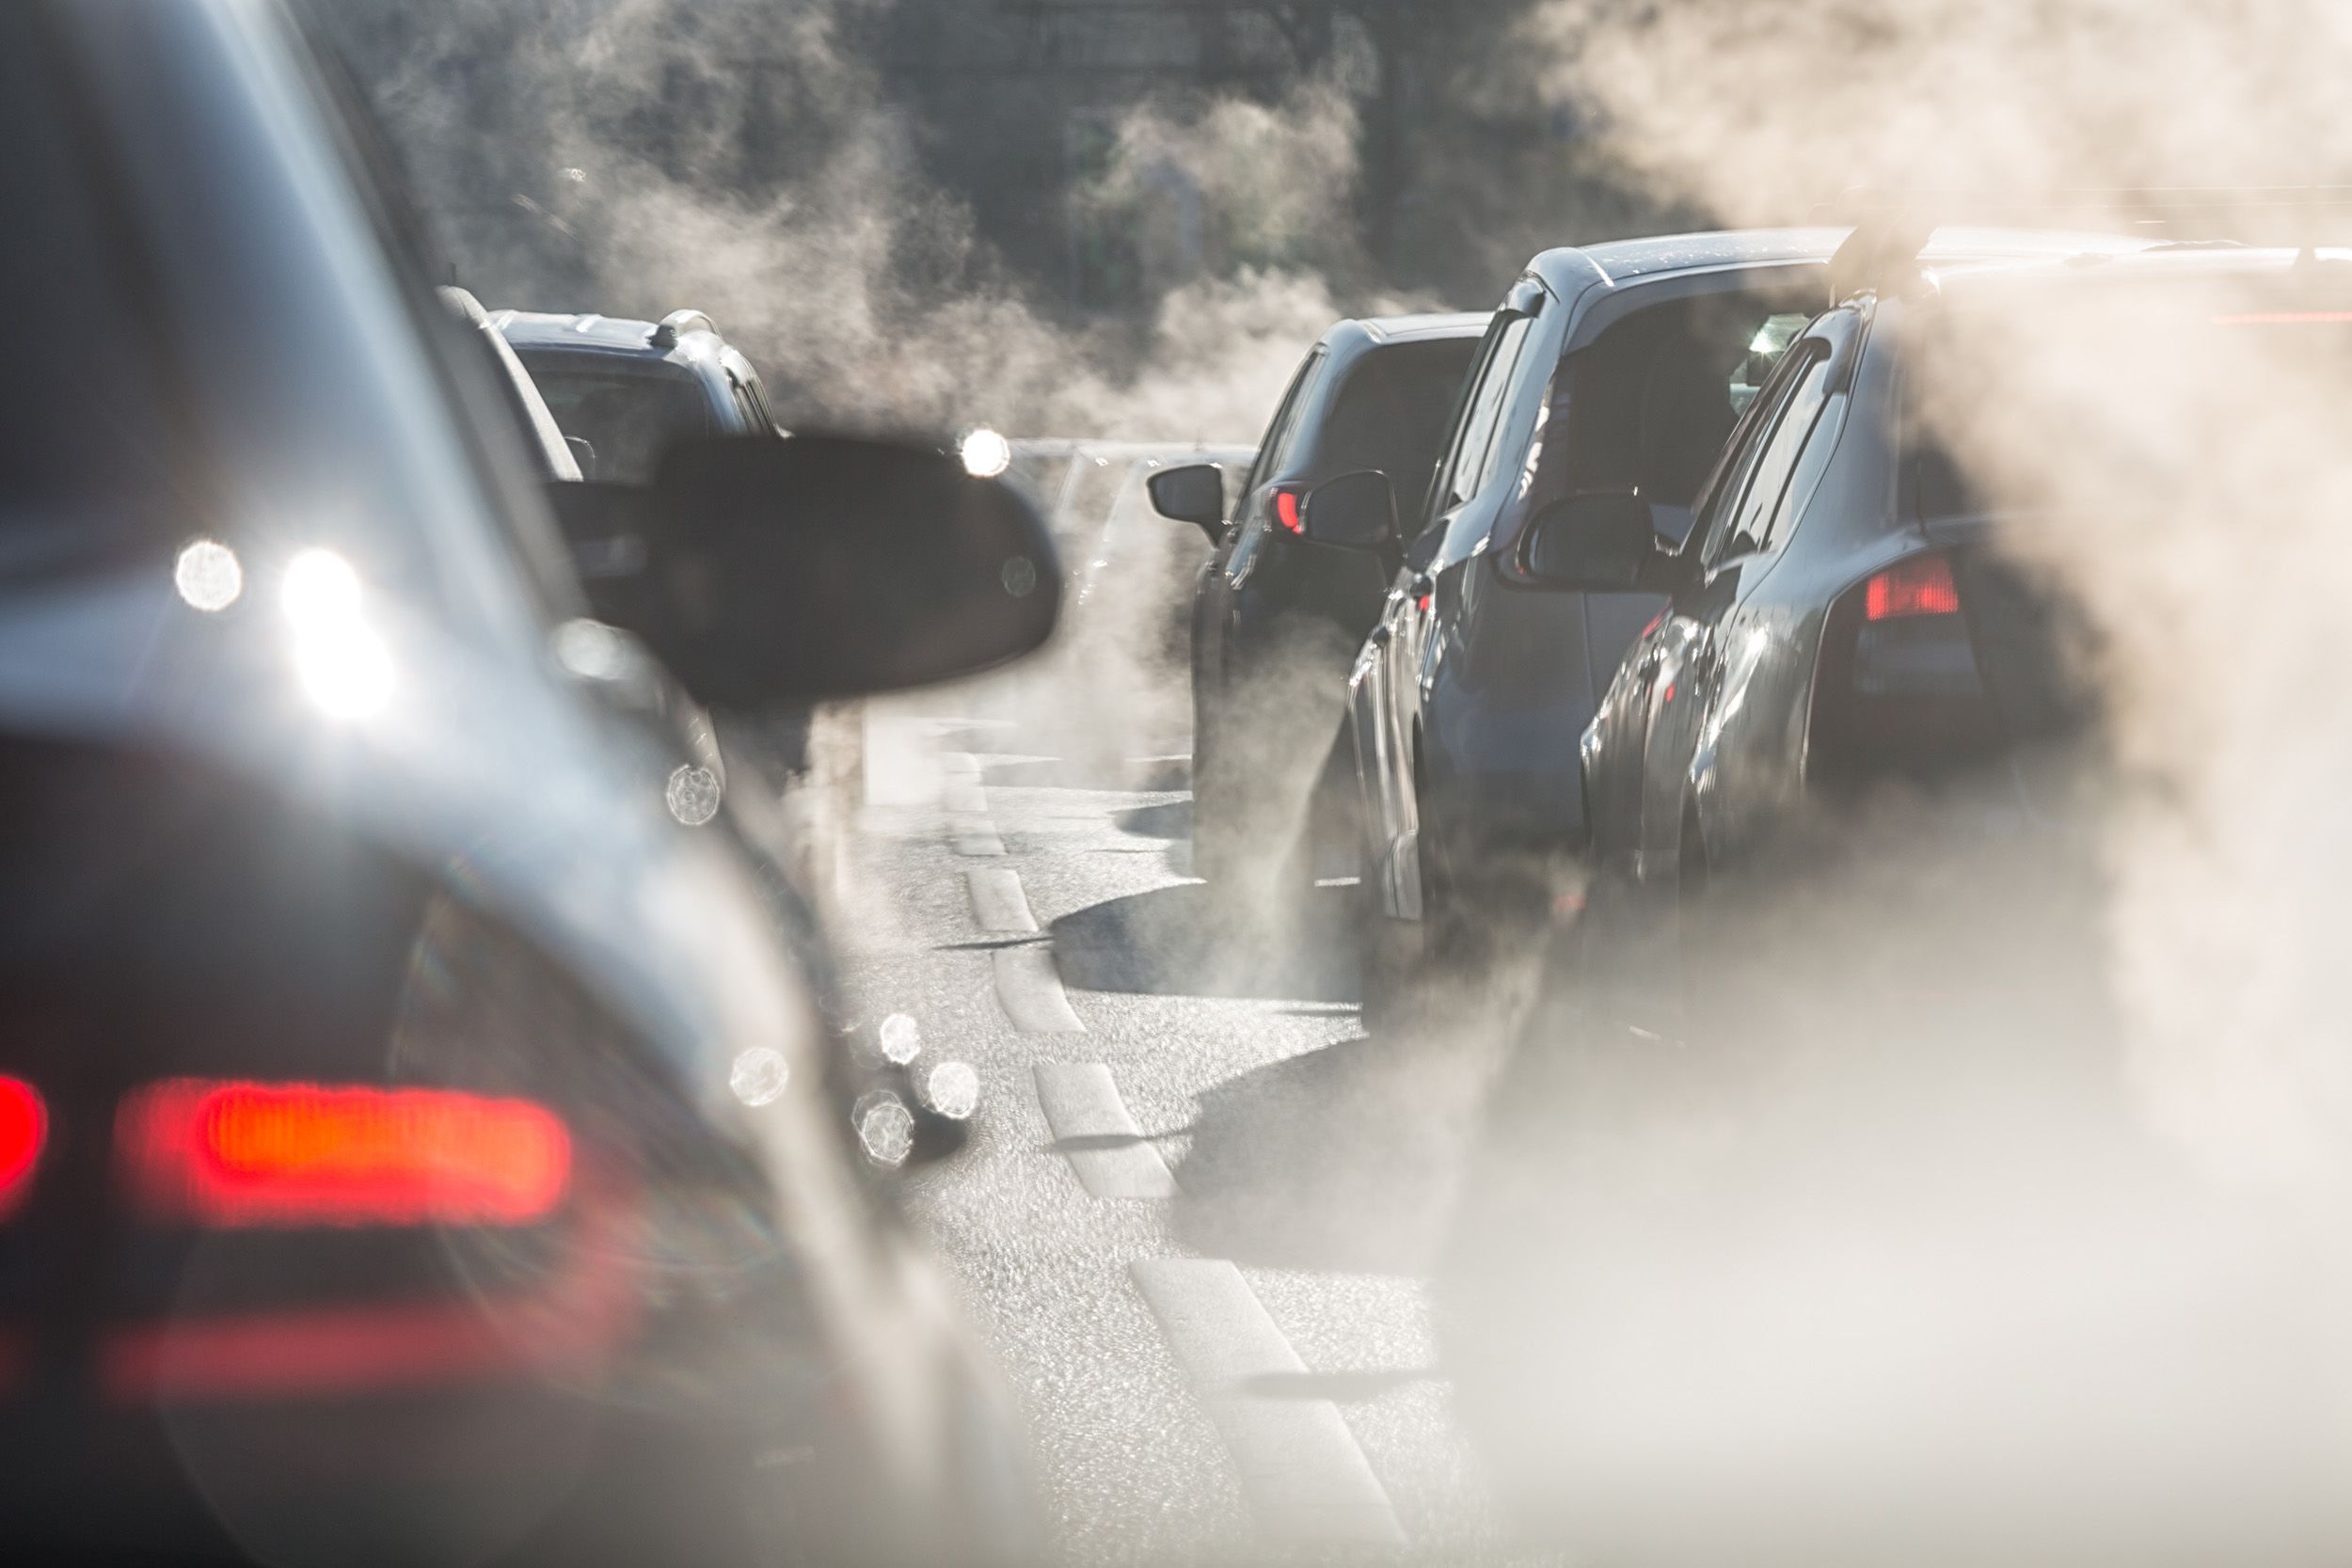
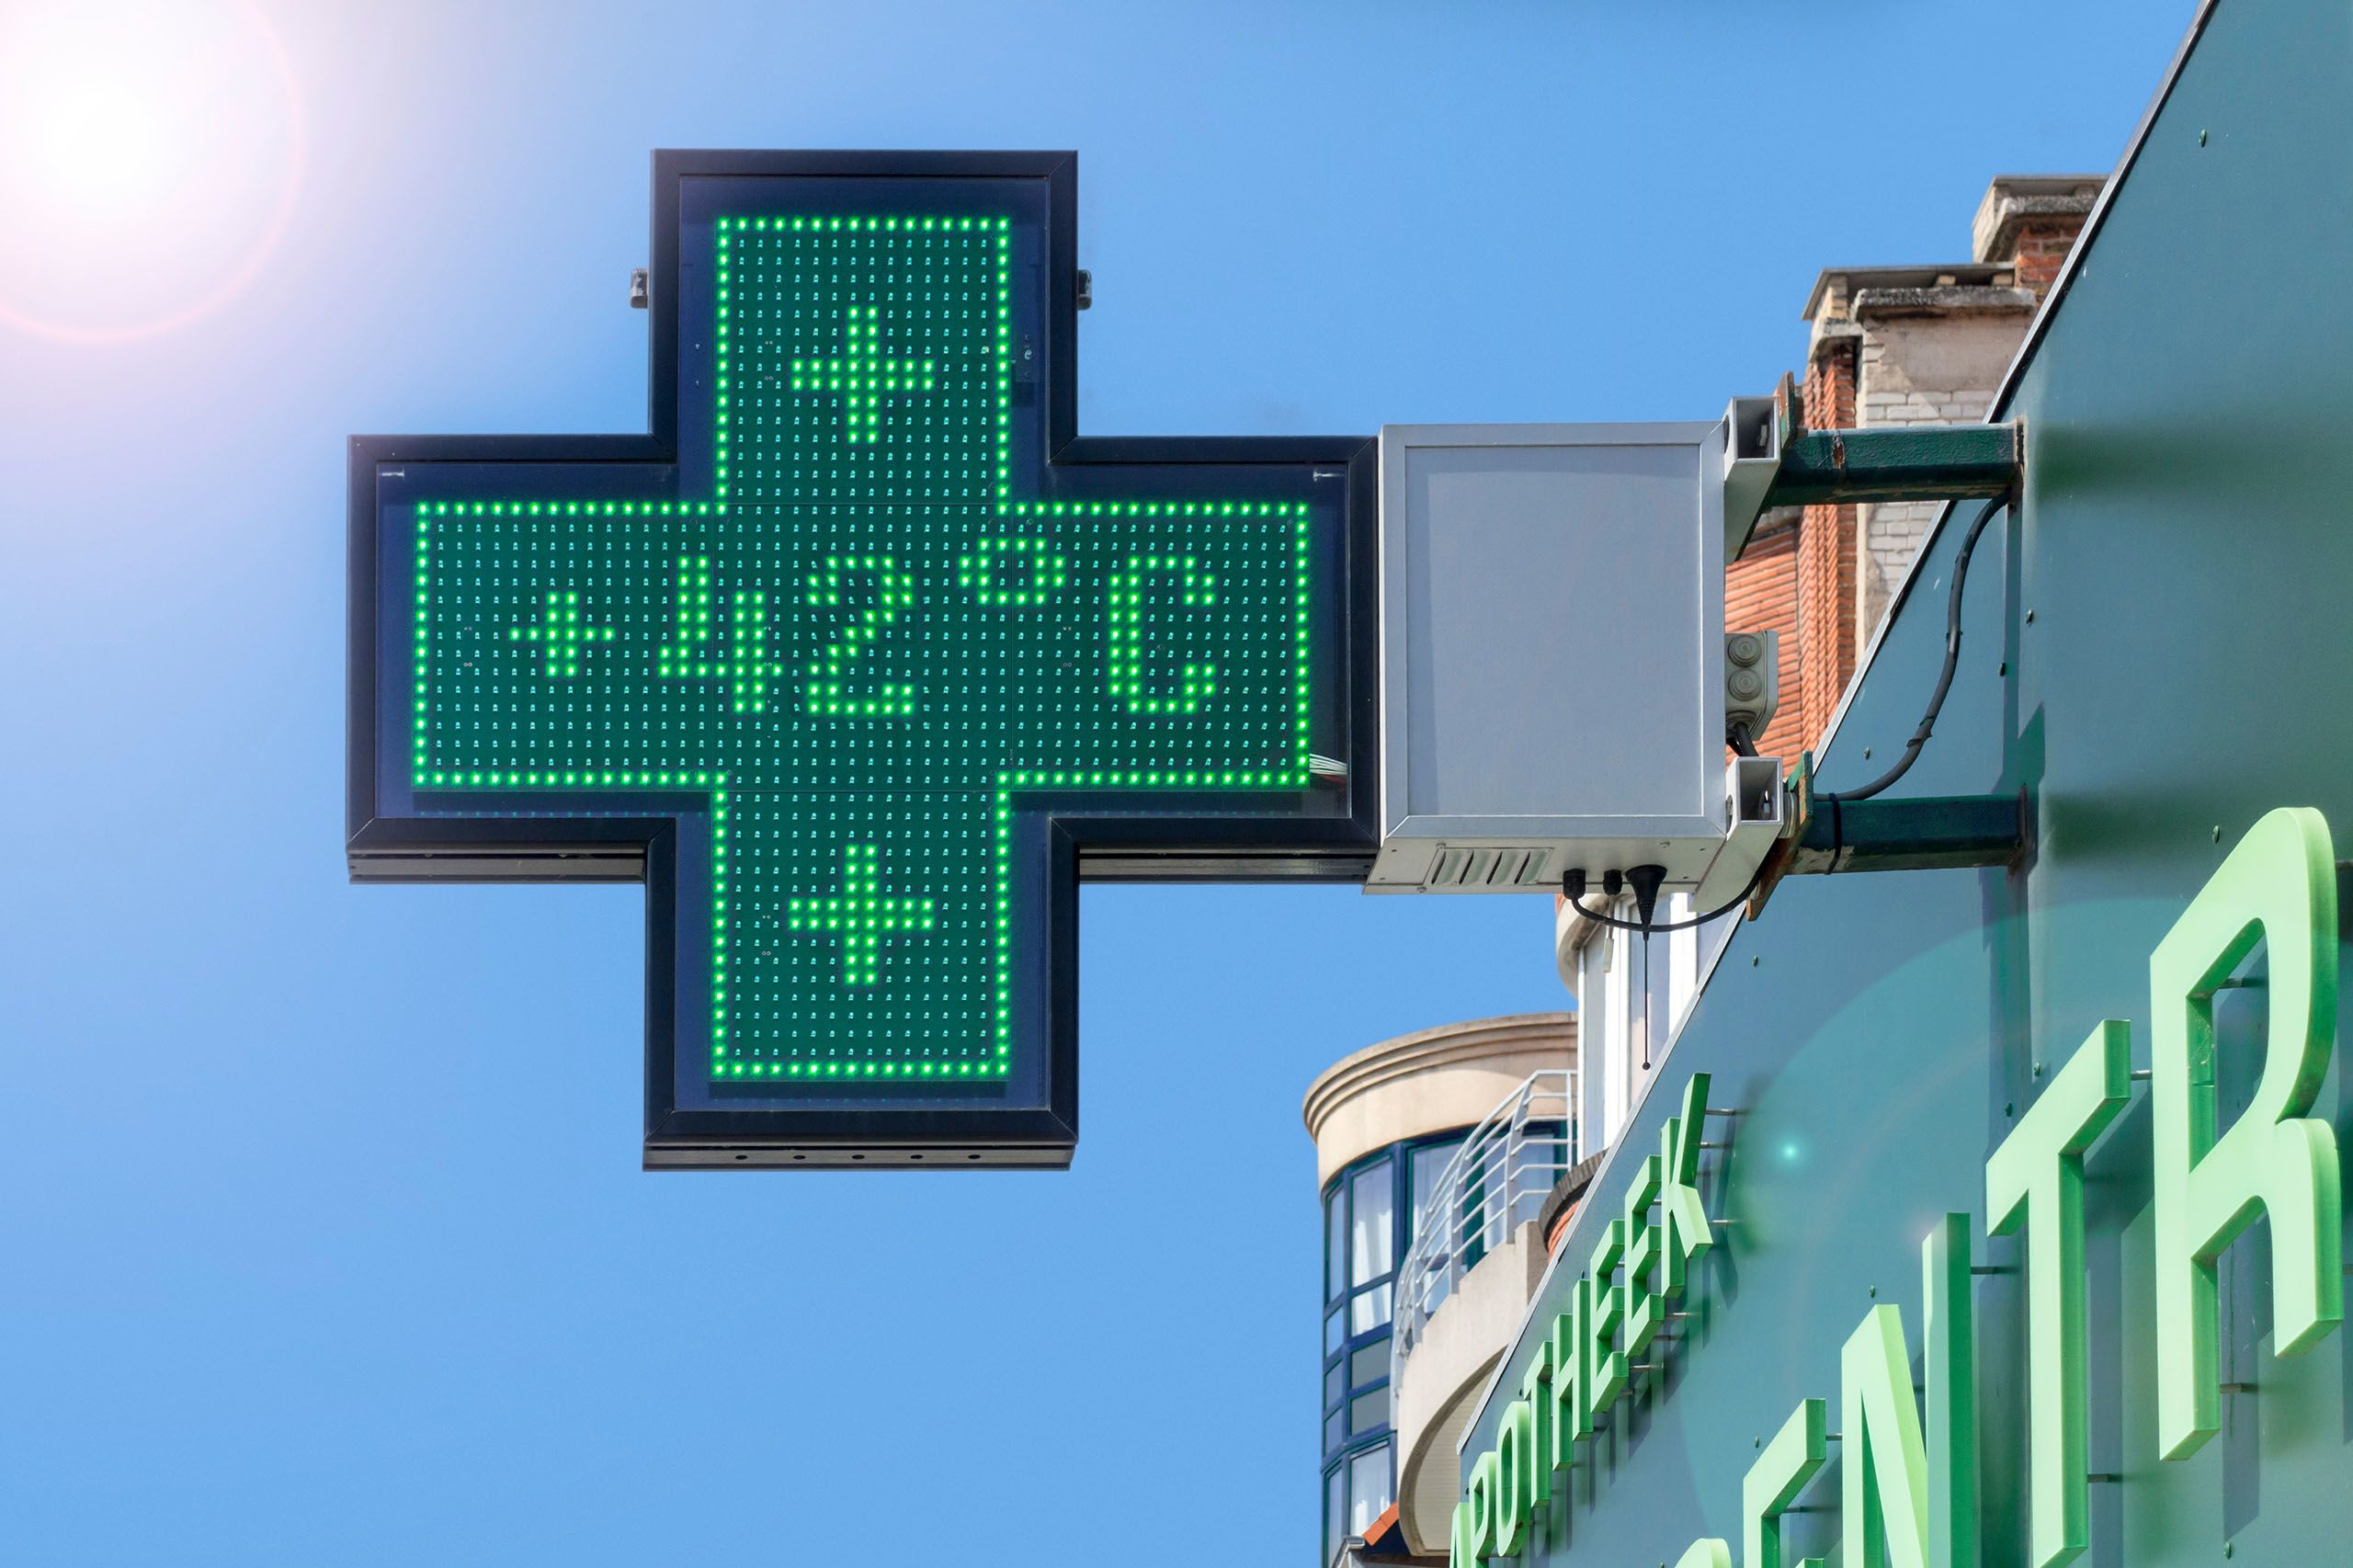
Poor air quality is a major public health problem; the World Health Organization estimates that 7 million people are killed by air pollution each year, with 500 000 premature deaths per year in Europe alone. Ingestion of these pollutants in the air can lead to a range of respiratory diseases, cardiovascular diseases and other complications.
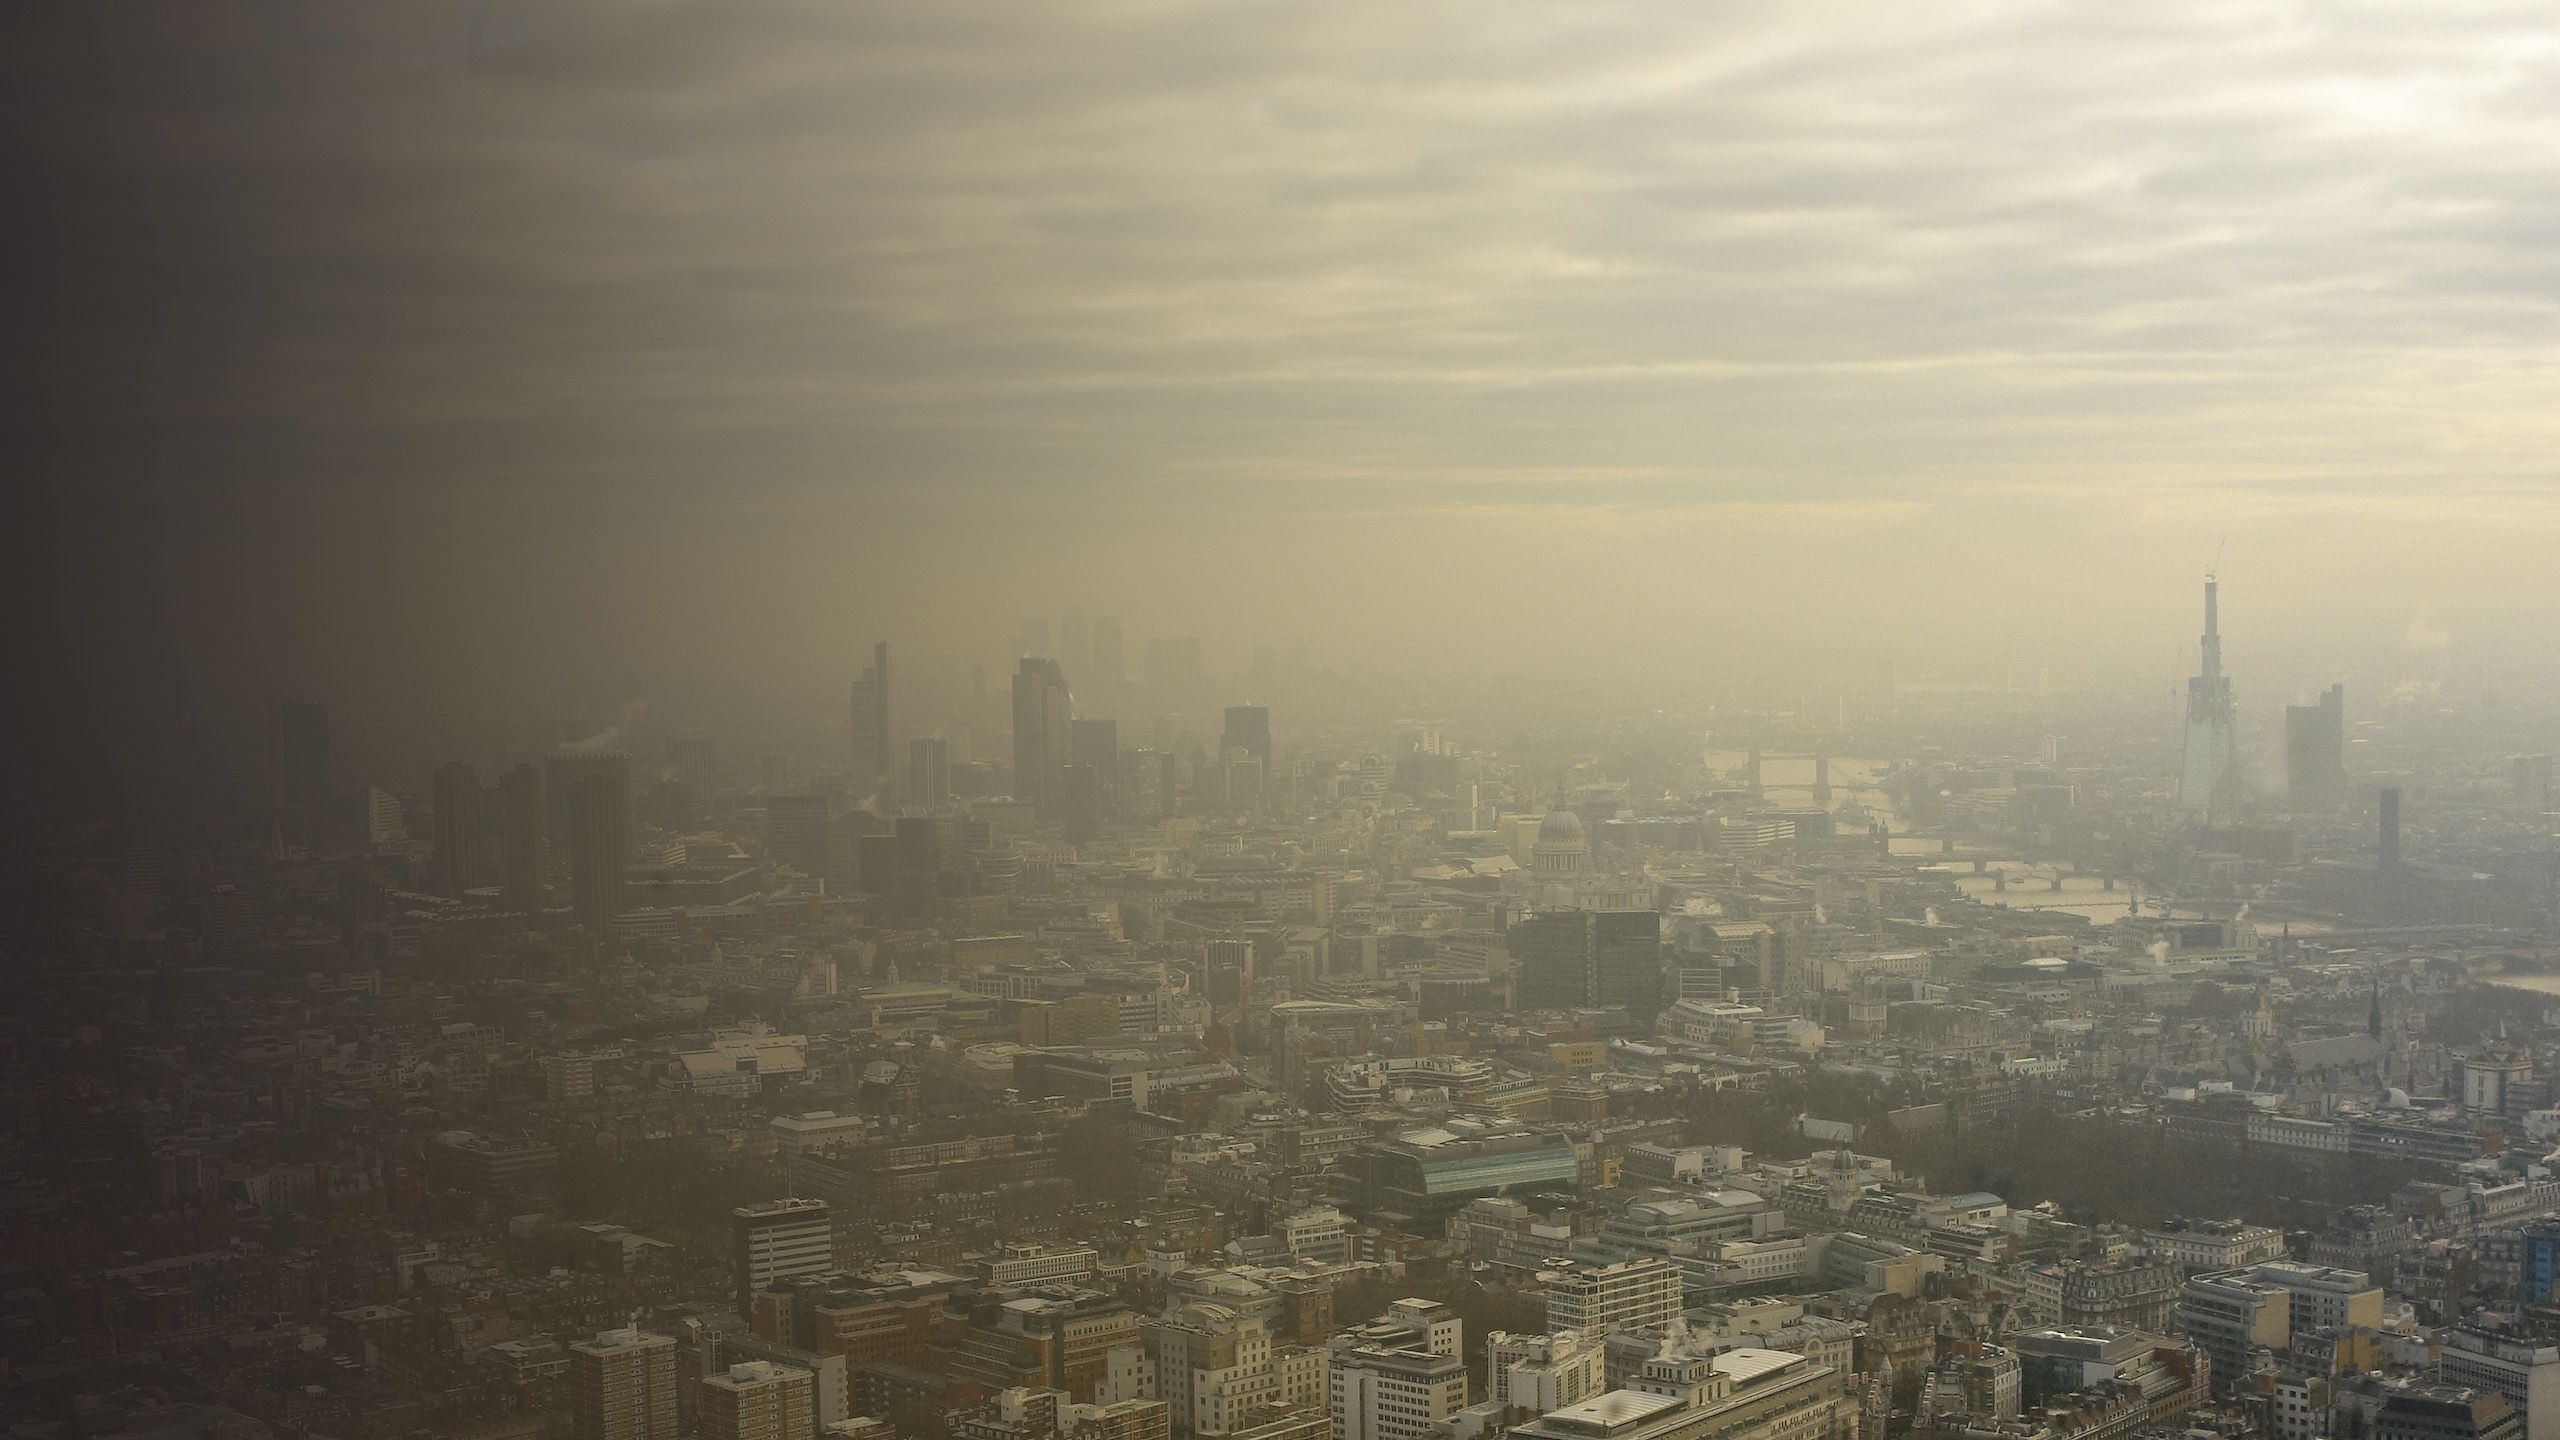
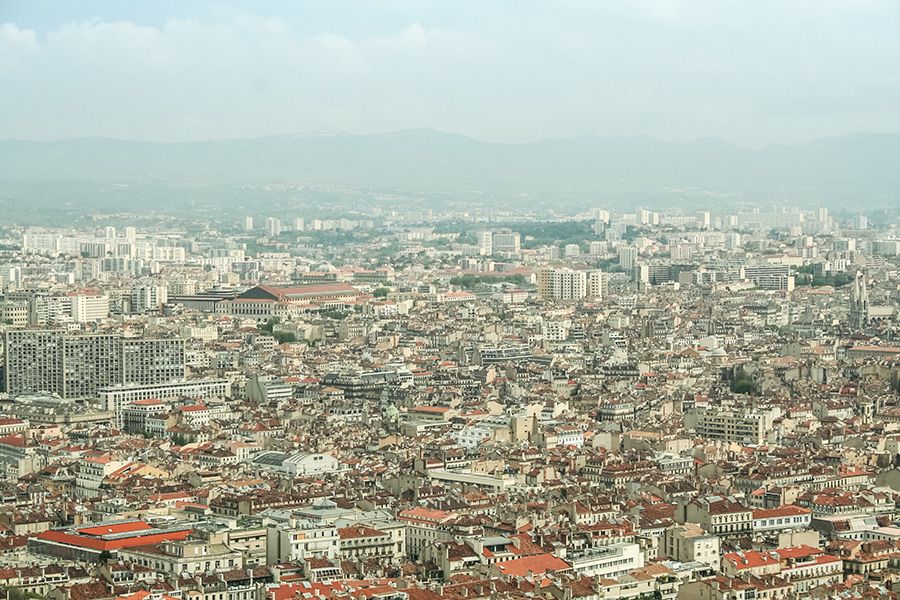
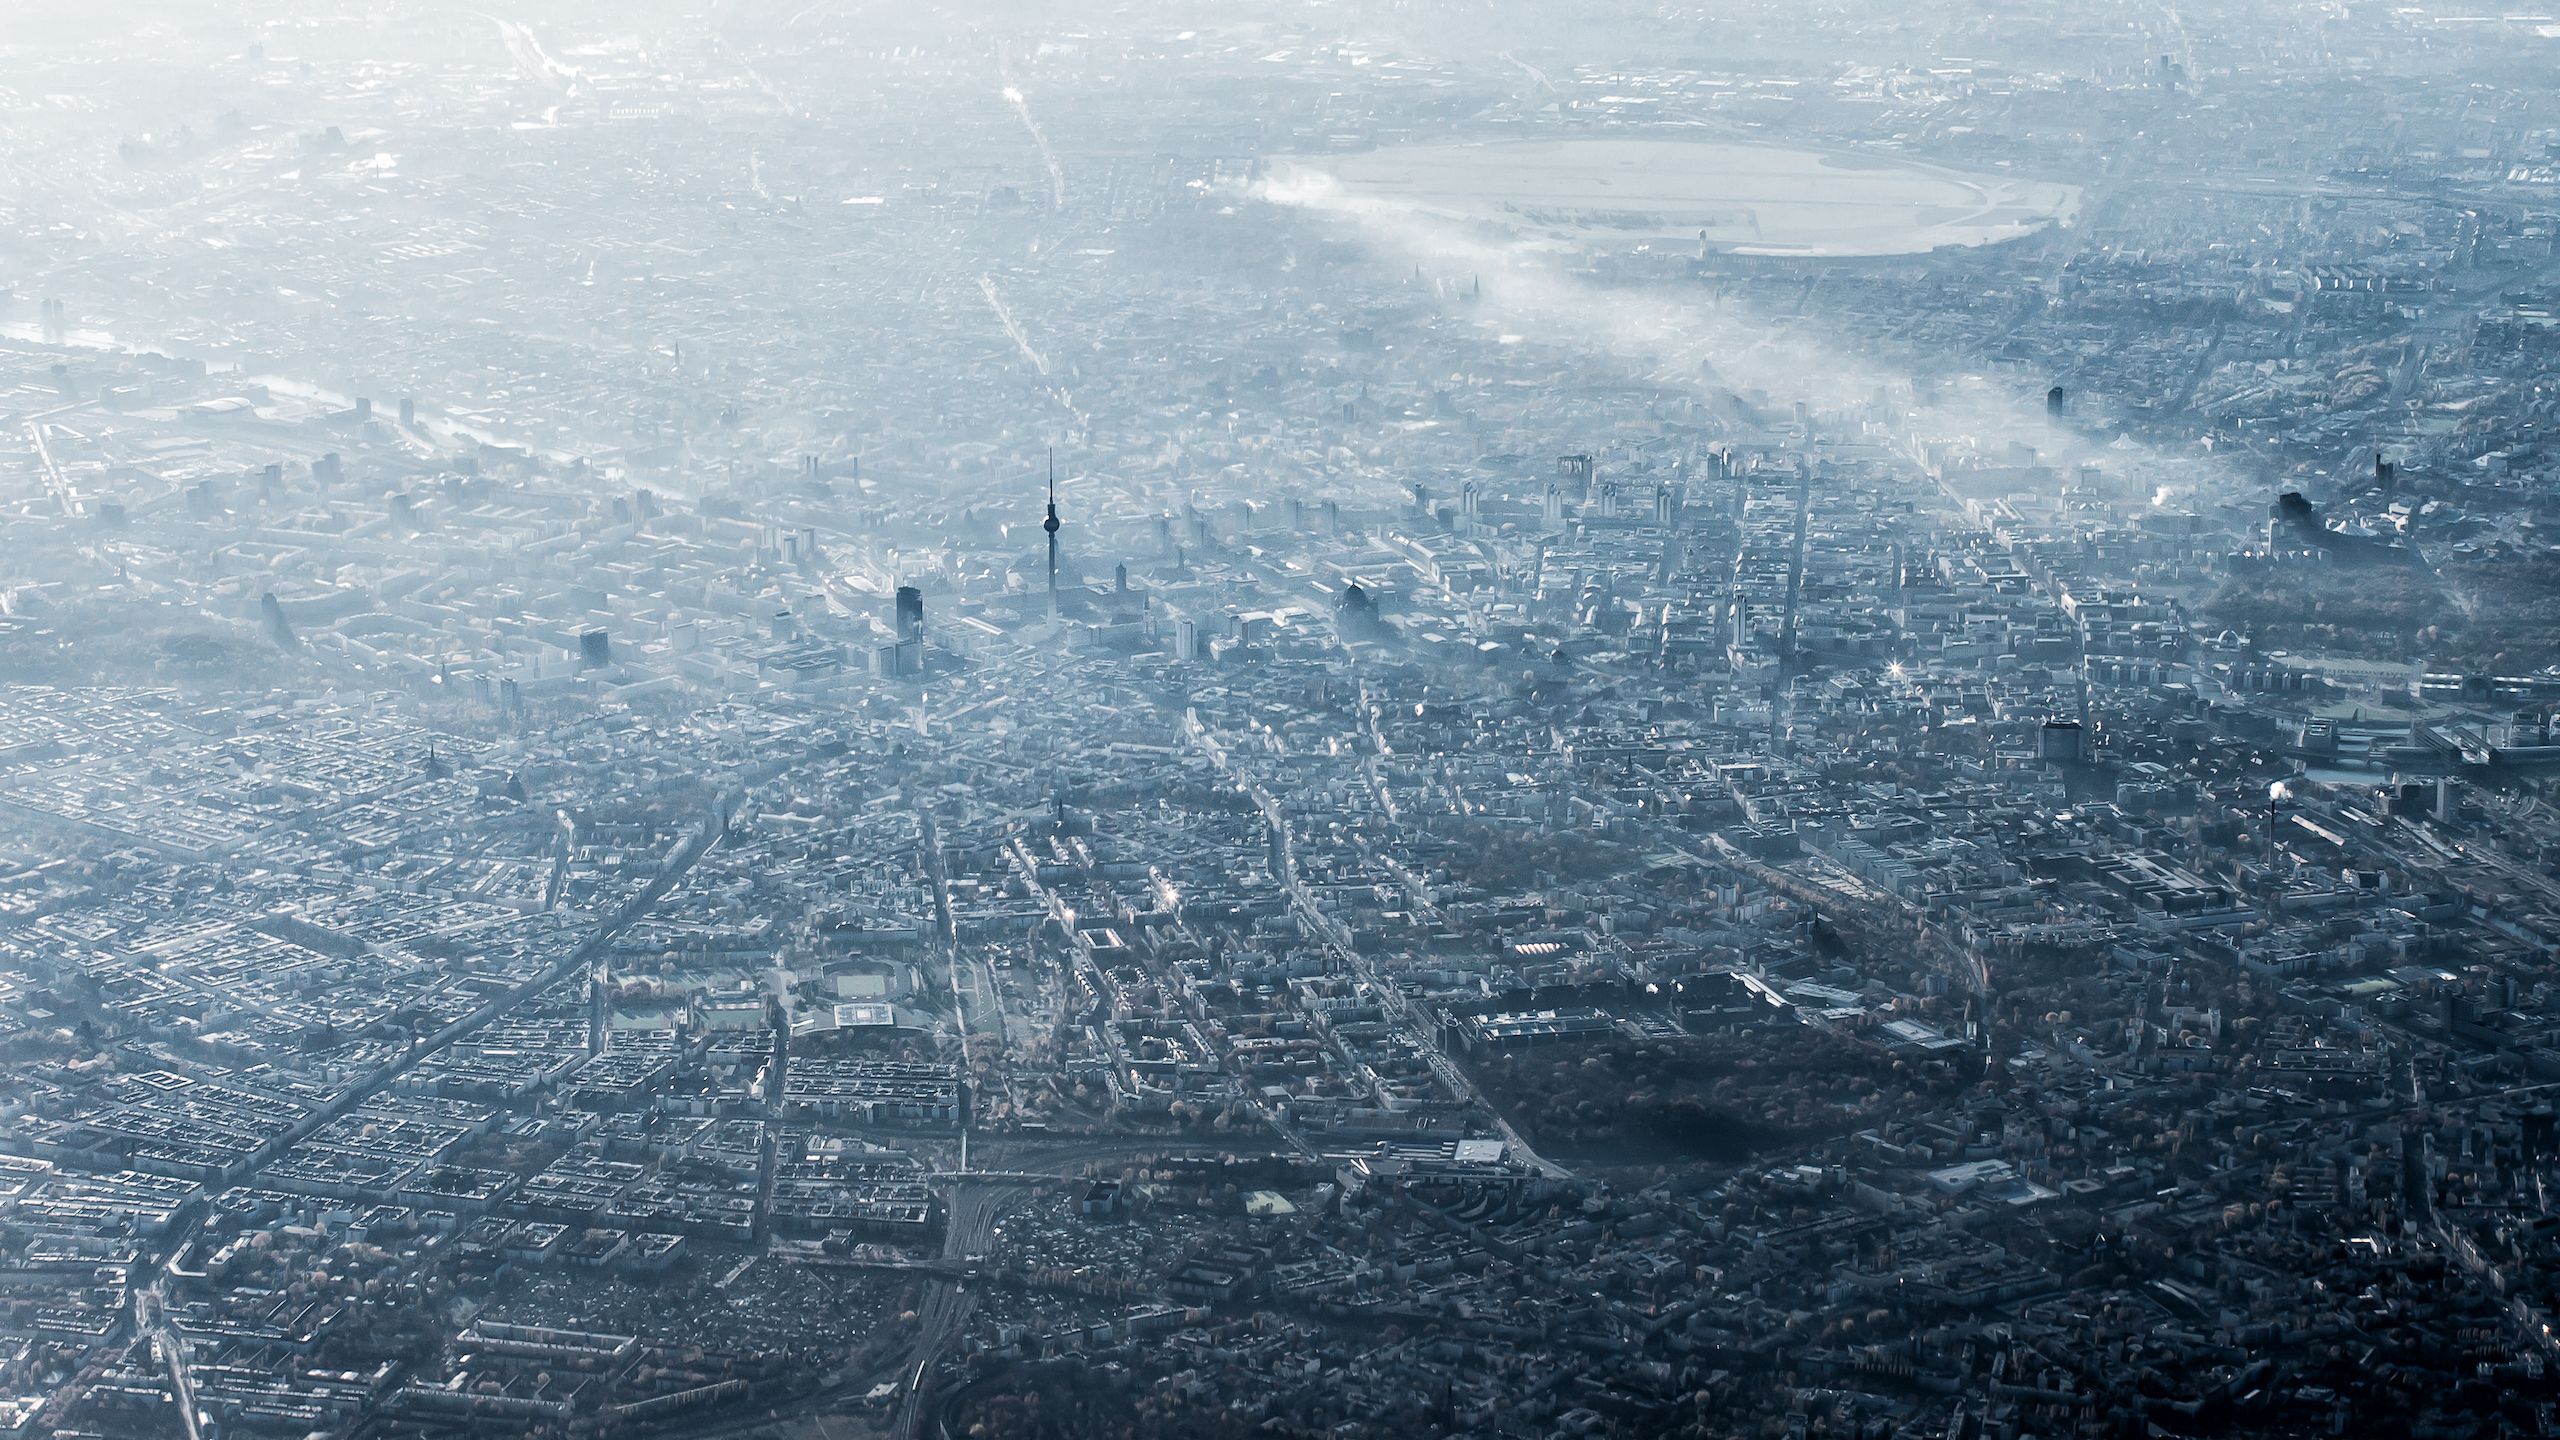
Climate change is normally considered to be an environmental catastrophe, but it is also a major public health problem. This is particularly true in urban centres, which are home to nearly three quarters of the European Union’s population.
Aside from building resilience into urban infrastructure, European countries must also protect the health of citizens from these new and worsening threats. And some citizens are now taking into account climate change and air quality when deciding where to live.
Not only air pollution and climate change impacting urban areas are harming our human health, but also allergenic pollen, UV radiation, heat and cold stress and diseases are relevant threats.


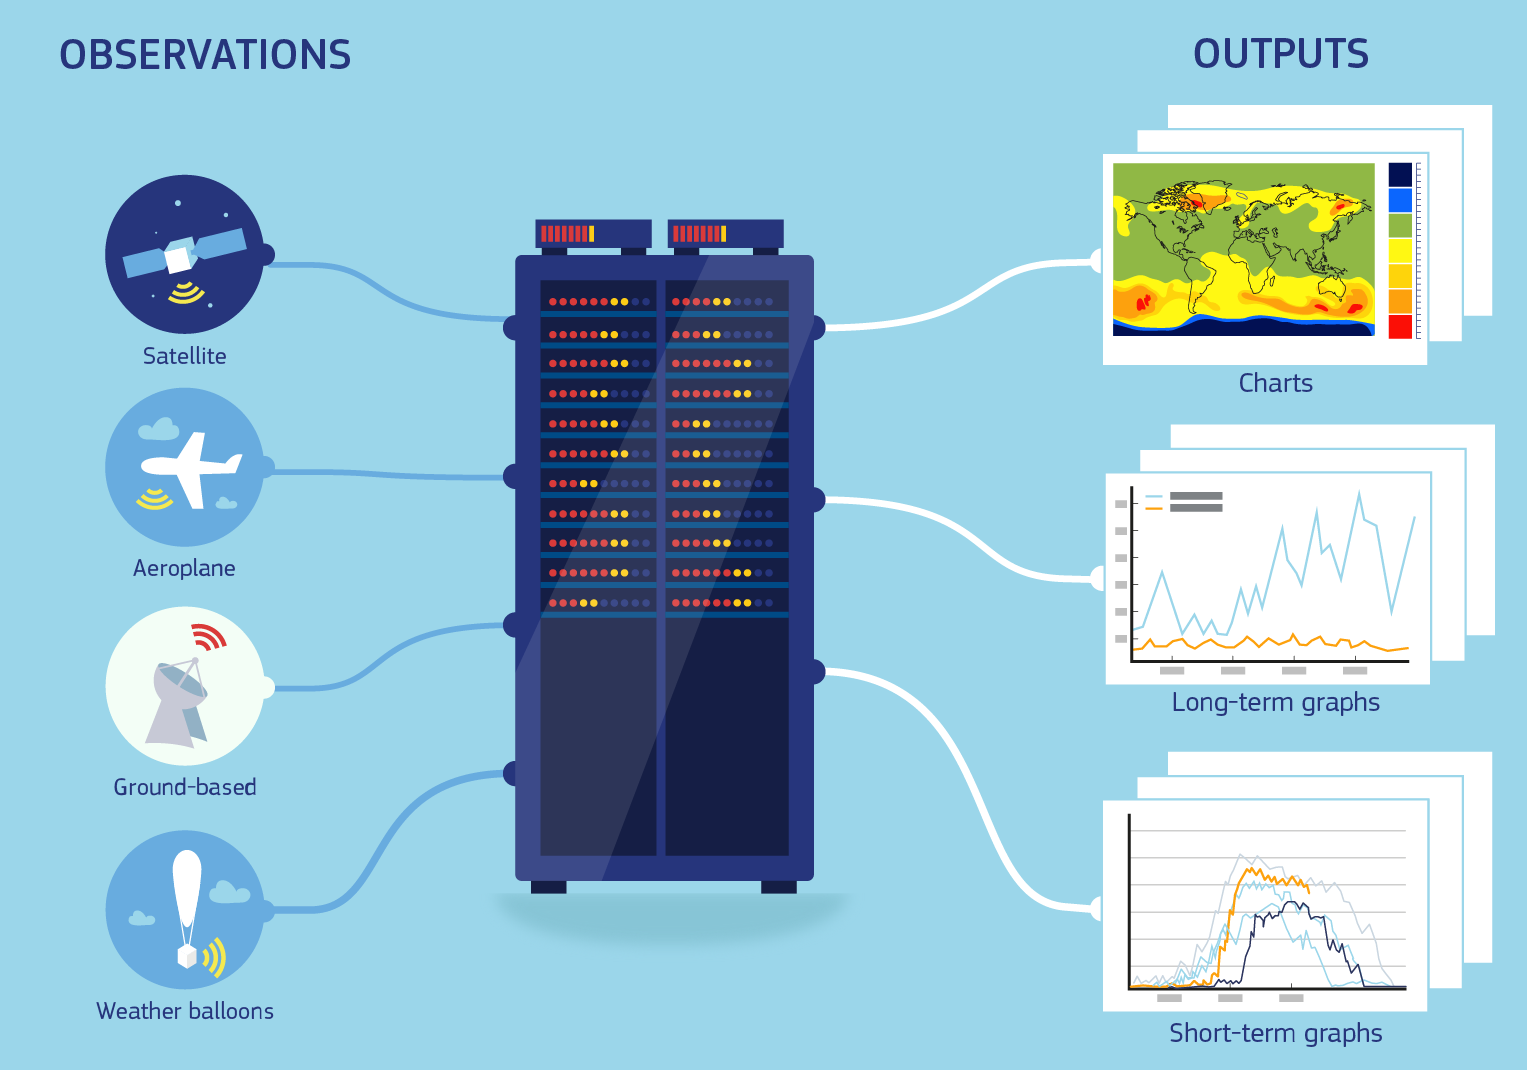
Using state-of-the-art modelling systems that are continually evaluated with millions of observations, every day the Copernicus services, including the Copernicus Climate Change Service (C3S) and the Copernicus Atmosphere Monitoring Service (CAMS) translate terabytes of atmosphere and climate data into useful information in free-to-use maps, tools and services, to help policymakers, businesses and citizens around the world.
One area where the application of C3S and CAMS data and tools is proving essential is public health. Users such as policymakers are empowered by understanding the coherences between public health, climate change and air quality, while small and medium-sized enterprises (SMEs), for example, can leverage the datasets to innovate health-related applications. Citizens' needs related to personal well-being and health also drive the meaningful use of this climate and atmosphere data.
Air quality: the problem
Every time we breathe in, we inhale small amounts of potentially harmful gases and small particles. Gases that can be classified as air pollutants include nitrogen oxides and sulphur dioxide, but air pollution also includes particulate matter – small particles that include dust and sand.
Air pollution can come from human sources, such as road traffic, energy production and agriculture, or natural sources such as volcanoes and wildfires. Wildfires are a big source of pollution; although they are a vital component of the Earth system, with the changing climate they are becoming more widespread. They emit ash and soot into the atmosphere that can worsen air quality.
In cities, infrastructure reduces airflow and populations are densely packed together, exacerbating air quality problems. But air quality is not a local problem. Just as clouds move through the sky, pollution is transported from one location to another by the wind.

Observations, both from satellites and from the ground, can provide a snapshot of the air quality, but have no real predictive capability. CAMS draws on Earth observations combined with numerical models of weather and atmospheric composition to create detailed analyses and forecasts of atmospheric composition and air quality. A key strength of these data is having the information on a homogeneous scale both in time and space. These data are used for initialising forecasts of global conditions, as well as European air quality. Organisations and authorities around the world can use these forecasts to their advantage.

CAMS combines observations with a numerical model of weather and atmospheric composition to create detailed analyses and forecasts of atmospheric composition. Credit: Copernicus Atmosphere Monitoring Service, ECMWF.
CAMS combines observations with a numerical model of weather and atmospheric composition to create detailed analyses and forecasts of atmospheric composition. Credit: Copernicus Atmosphere Monitoring Service, ECMWF.
One satellite that is a great source of data is Copernicus Sentinel-5P, from which CAMS is actively assimilating observations of the pollutants ozone, nitrogen dioxide and sulphur dioxide. CAMS is also investigating including data from the Copernicus Sentinel-3 satellite into its tool for monitoring wildfires – the Global Fire Assimilation System (GFAS). GFAS uses satellite observations to produce daily estimates of the emissions of pollutants from fires.
Local and national authorities need data on air quality – especially pollutants such as PM2.5 and PM10 – to create air quality and public health assessment maps. These maps are mainly used to monitor the air quality. In addition, they can be used to estimate the number of lives lost and premature deaths, as well as changes in life expectancy.

Air quality: solutions for monitoring and forecasting
CAMS produces data on air quality by combining several European air quality models in an ensemble approach. This greatly enhances the quality and uncertainty estimates of its predictions. Data on a variety of variables are provided through the Atmosphere Data Store (ADS), including PM2.5 and PM10, and also PM1 – particulate matter with diameter less than 2.5, 10, and 1 micrometre, respectively. The data are also provided in a simple visual format that allows users to select by variable, and to explore data for major European cities including European capitals.
Policymakers at European and national levels often express a need for easy-to-use, high-quality and validated information to respond to societal and environmental concerns.
CAMS data are used to create robust yet simple-to-use health tools, such as air pollution and pollen tracking apps. The design of these customised apps is driven by the needs of individuals and decision makers, but implemented by specialist data users who can understand and manipulate the added value of CAMS data. CAMS monitoring and forecasting is available from surface level to the upper layers of the Earth's atmosphere.

Air pollution information for policy making
“The source receptor products developed under the Copernicus air quality service are especially useful for Member States to understand strategies to reduce air quality emissions in their countries.”
Windy: easy access air quality forecasts
Windy nitrogen dioxide forecast, based on CAMS data. Credit: Windy using CAMS data
CAMS’ partnership with weather forecast visualisation service Windy aims to deliver global air quality information through a web and smartphone application.
Windy shows a high-resolution map overlaid with easily understood visuals of various weather elements. The partnership with CAMS provides information on PM2.5, as well as nitrogen dioxide, aerosols, the ozone layer, fire intensity, surface ozone and sulphur dioxide. Over 3.5 million people have used the Windy layers powered by CAMS.
“The benefit of using CAMS data for Windy is that we believe that we have attracted many new users who are interested in air quality, which we didn’t have previously.”
Allergenic pollen: the problem
Scientists believe that more people are becoming sensitive to pollen as the climate changes. In 2007, it was estimated that 40% of the European population suffered from some form of pollen allergy. Aside from the obvious health impacts, this has a big impact on the economy; in 2014, it was predicted that people being insufficiently treated for allergies indirectly costs the EU up to 150 billion euros per year in absenteeism and presenteeism. A significant proportion of these people suffer from a pollen allergy, with the most common form of pollen allergy being allergic rhinitis – or hay fever.
Climate change is exacerbating allergies worldwide: rising temperatures will steadily increase the ranges of many plant species that produce pollen spores, and lengthening growing seasons bring further exposure. In cities, pollen mixes with other pollutants, and poorer air quality makes allergic responses worse. Monitoring and forecasting airborne pollen is vital for ensuring better information for citizens and providing adequate treatments.


Allergenic pollen: solutions for monitoring and forecasting
CAMS uses numerical modelling and observational data to monitor pollen concentrations of the most common species – currently alder, birch, olive, grass, mugwort and ragweed – at a resolution of around 10 kilometres, and provide forecasts up to four days in advance.
The information is provided as part of the CAMS ‘European air quality forecasts’ dataset, available in the ADS, which includes data on pollen concentrations in combination with other air quality data.
PASYFO: Personal allergy symptom forecasts
Researchers at the Vilnius University Šiauliai Academy in Lithuania, the Medical University of Vienna in Austria, and the Finnish Meteorological Institute use CAMS pollen data in PASYFO (Personal Allergy Symptom Forecasting system) – a unique mobile application offering personalised symptom forecasts.
“For PASYFO we need to have as much data as possible to make pollen allergy symptom forecasts, and CAMS is amazing because we can have so many variables; we use for example, ozone, sulphur dioxide, nitrogen dioxide, particulate matter and pollen.”

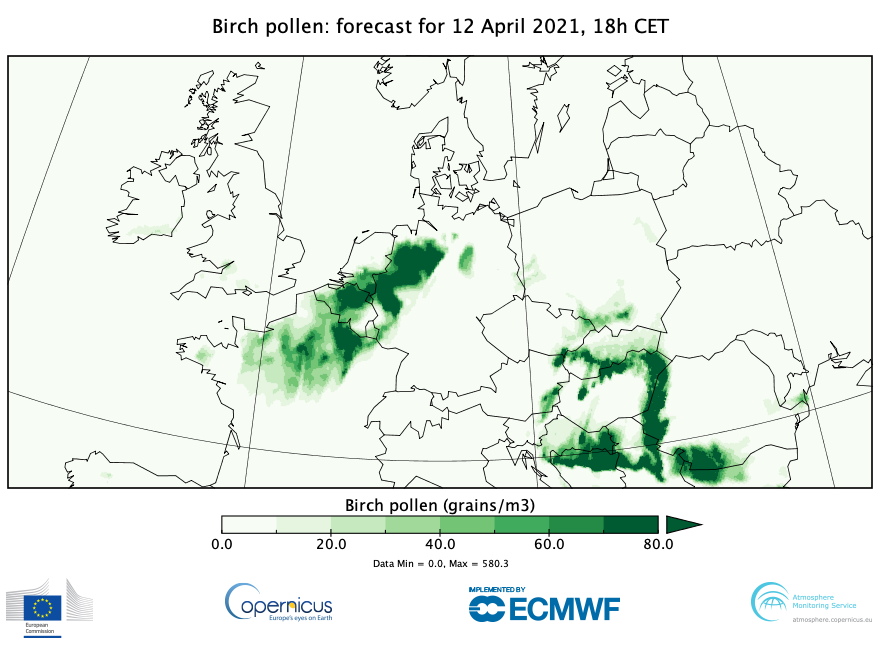
CAMS forecast of birch pollen for 12 April 2021. Credit: Copernicus Atmosphere Monitoring Service/ECMWF.
CAMS forecast of birch pollen for 12 April 2021. Credit: Copernicus Atmosphere Monitoring Service/ECMWF.

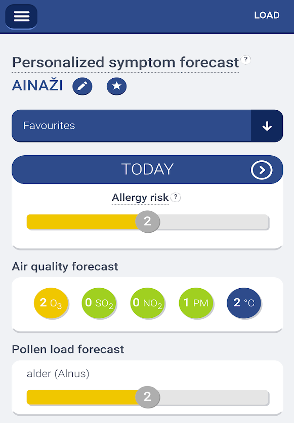
Screenshot from the PASYFO mobile application. Credit: PASYFO
Screenshot from the PASYFO mobile application. Credit: PASYFO
The app provides detailed pollen allergy symptom forecasts for users in Latvia and Lithuania. It allows users to personalise their symptom forecasts, and delivers information on a range of common allergenic pollens across Europe.
UV rays and the ozone layer: the problem
UV radiation is the main cause of skin cancer. A common misconception is that it is the visible and infrared radiation from the Sun that burns skin and cause cancer, so many people check the weather forecast rather than the UV forecast to assess their risk of sunburn. But UV radiation is invisible and cannot be felt. UV levels can be damagingly high even on cloudy, cool days.


Overexposure to UV radiation can lead to a range of health problems in humans, from skin damage to skin cancer. UV also harms the eyes, causing cataracts, inflammation of the conjunctiva and cornea, and damage to the retina.
UV levels are affected by many factors, including the amount of ozone, the time of day, cloud cover, aerosol particles in the air, and geographic positioning. The ozone layer is Earth’s natural sunscreen; it prevents much of the Sun’s harmful UV radiation from reaching Earth’s surface.
The ozone layer in the stratosphere contains 90% of the atmospheric ozone. The other 10% is closer to the ground in the troposphere, where it is a pollutant and can be harmful to human, animal and vegetation health.
UV rays and the ozone layer: solutions for monitoring and forecasting
CAMS constantly monitors and forecasts levels of ozone in the atmosphere. CAMS also monitors and forecasts levels of UV radiation reaching Earth’s surface by integrating direct measurements of ground-based monitoring stations and satellites into their forecast models. This information is based on stratospheric ozone levels, as well as cloud cover and aerosol particles in the atmosphere.
This data has been used to create a visualisation tool, allowing users to select ozone and UV radiation and see them on a map.
CAMS data is now underpinning the UV forecast provided by the European Climate and Health Observatory, an initiative by the the European Environment Agency (EEA), the European Commission DG CLIMA and DG SANTE to support climate change adaptation with respect to human health in Europe.


CAMS forecast of how the ozone hole would change between 9 and 14 September 2019. Credit: Copernicus Atmosphere Monitoring Service, ECMWF.
“We needed the data that would present the maximum daily value of the UV index because it is the maximum daily value that is the most meaningful to human health”
In 1988, Cancer Council Victoria and the Victorian Government in Australia established SunSmart, a programme to educate citizens about the dangers of UV radiation and its relation to skin cancer. The SunSmart App is now available in a global version aimed to improve global awareness on UV protection.
SunSmart uses daily UV index forecasts from CAMS. Using this information, the app warns users when the UV index is likely to reach three or higher. By using the location of the mobile device, it can inform users when to use Sun protection and provide information about UV levels, as well as associated information such as temperatures.

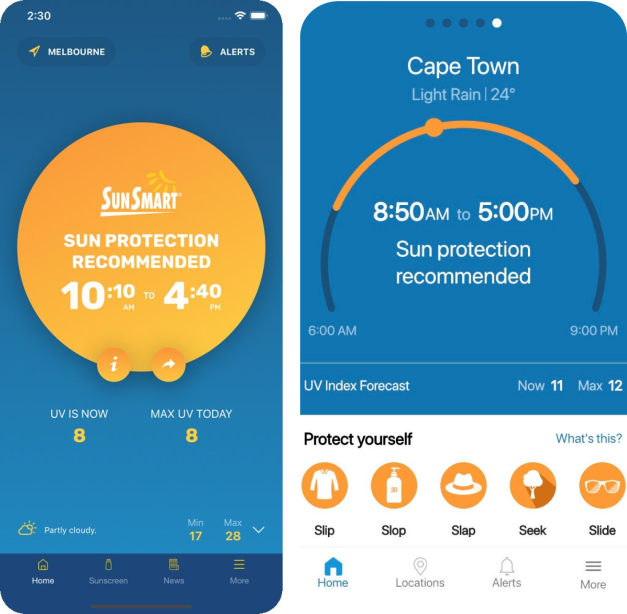
Screenshot from the SunSmart mobile application. Left: Australian version, right: global version. Credit: Cancer Council Victoria/Victoria State Government
Screenshot from the SunSmart mobile application. Left: Australian version, right: global version. Credit: Cancer Council Victoria/Victoria State Government
“When the bureau switched to using the CAMS UV index it was able to increase the length of the forecast period from two days to five days and increase the number of specific location-based forecasts from around 200 to over 700 each day. The routine validation and verification performed by CAMS gives a high level of confidence in the UV forecasts and the ongoing multinational support is vital in maintaining this service in the long term. For these reasons, the Australian Bureau of Meteorology has great confidence in this world-class forecast dataset.”
Craig Sinclair – Head, Prevention Division and Director, World Health Organization Collaborative Centre for UV Radiation at Cancer Council Victoria
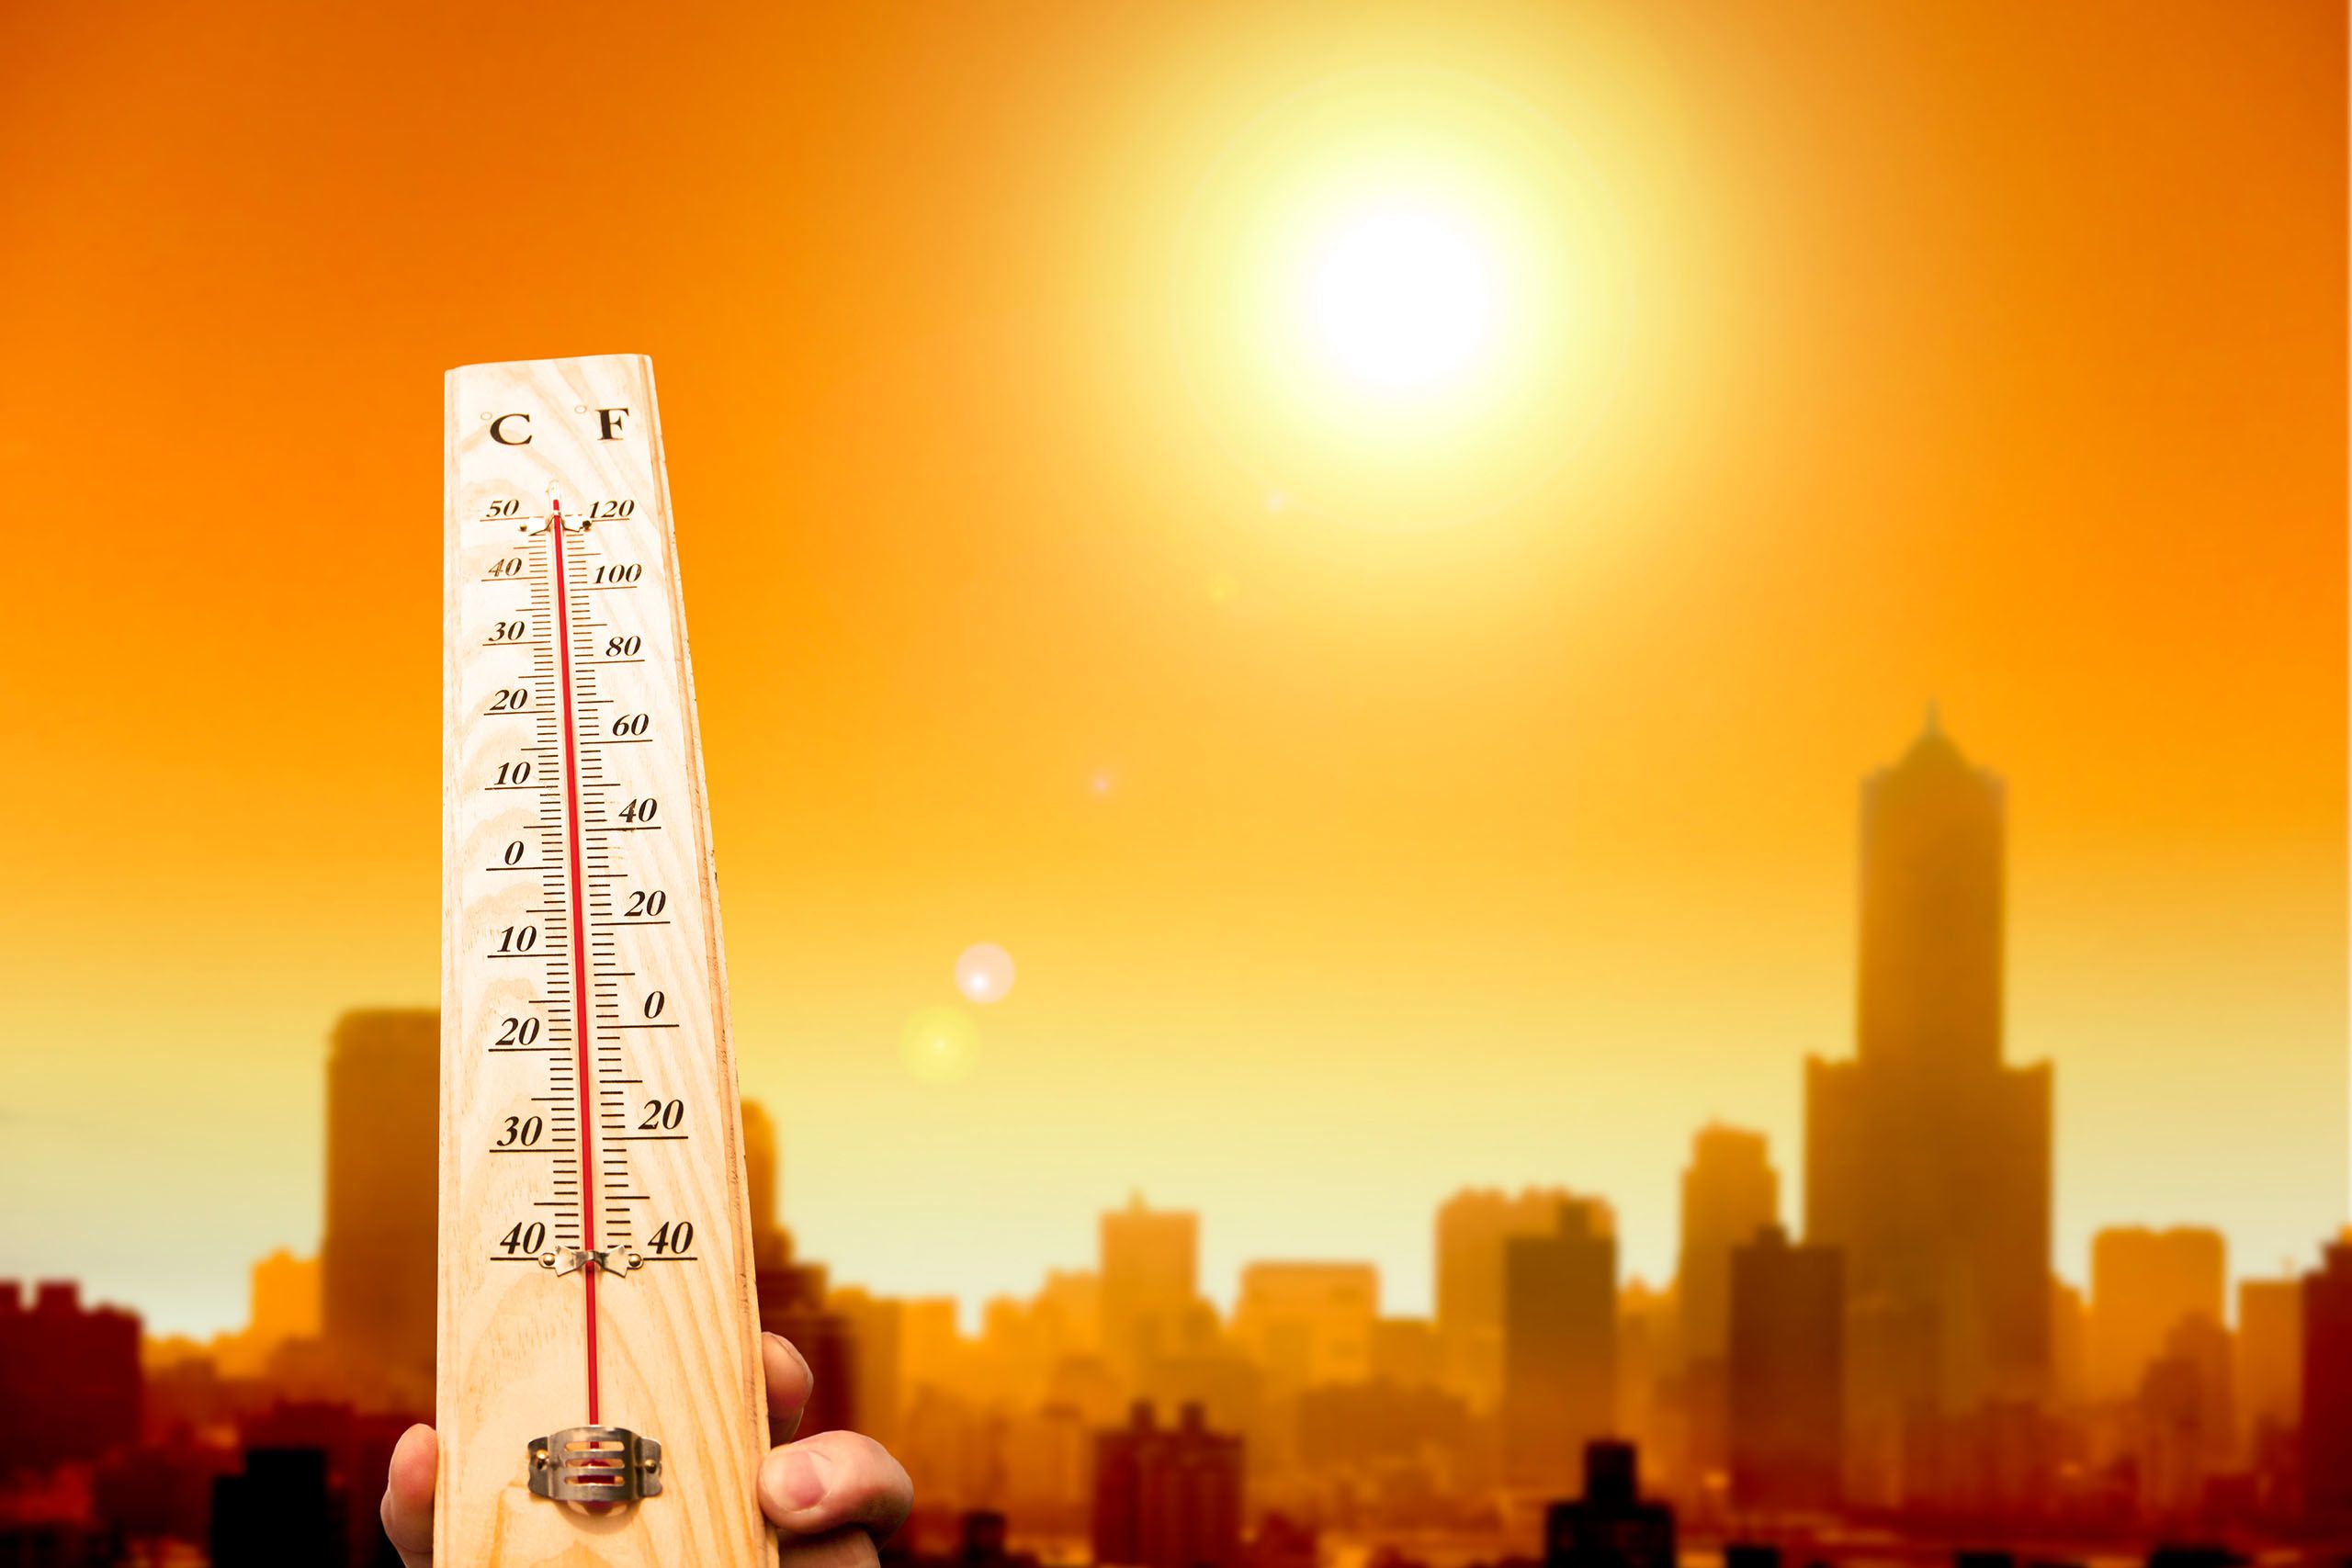
Heat and cold stress: the problem
As the climate changes further, episodes of extreme heatwaves and cold snaps are likely to occur with greater frequency and intensity. Governments will need data to carry out mitigating actions to counter these weather swings, while citizens may want to assess how their local climate will evolve in the coming decades.
If the world warms by 3°C by the end of this century, projections show that the number of citizens in the EU (and UK) exposed to heatwaves will rise to nearly 300 million per year. For comparison, in 1981–2010 the average was 10 million per year.
Excess heat can kill, particularly the most vulnerable members of society. When our bodies cannot get rid of excess heat, our core temperature rises and our heart rate increases – this is heat stress, and it can lead to heat stroke or heat exhaustion. It can also cause a wide range of other health issues, including cardio-vascular problems. When humidity is high, the ability of our bodies to sweat is limited, meaning humans cannot cool down as much as we need to. In 2019, a record 475 million additional heatwave exposures were observed around the world.
Heat-related impacts are compounded in cities, which suffer from the ‘urban heat island’ effect due to infrastructure covering up and disrupting Earth’s natural cooling mechanisms. Concrete and buildings absorb heat, for example, pushing temperatures higher.


Heat and cold stress: solutions for monitoring and forecasting
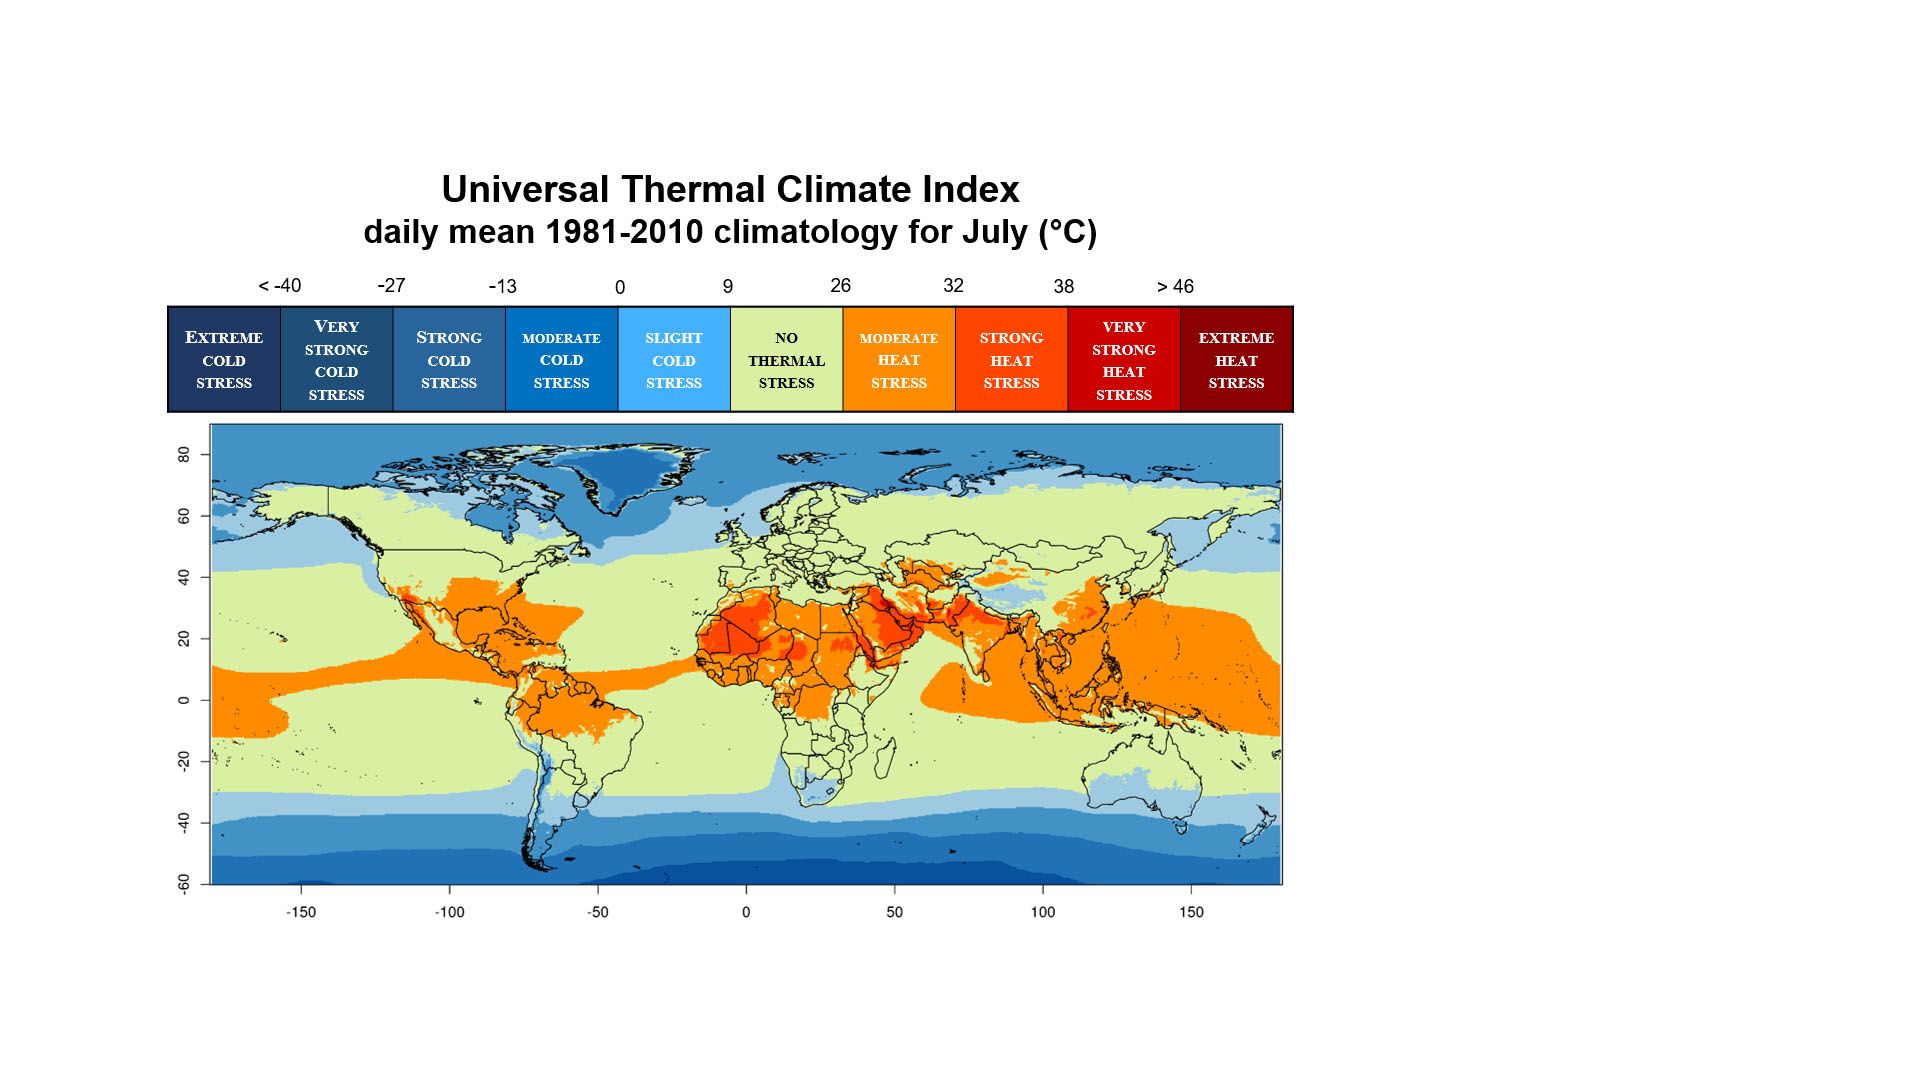
Information on heat and cold stress is often represented through thermal stress indicators such as the Universal Thermal Climate Index (UTCI), which is available through the C3S Climate Data Store (CDS).
Partner organisations across the European Union have developed a wide range of innovative tools using C3S data, showing temporal and geographic changes relating to heat and cold and its impacts on human health. These customised tools give added value to Copernicus data and make the health-related impacts of climate change accessible to both individuals and society.
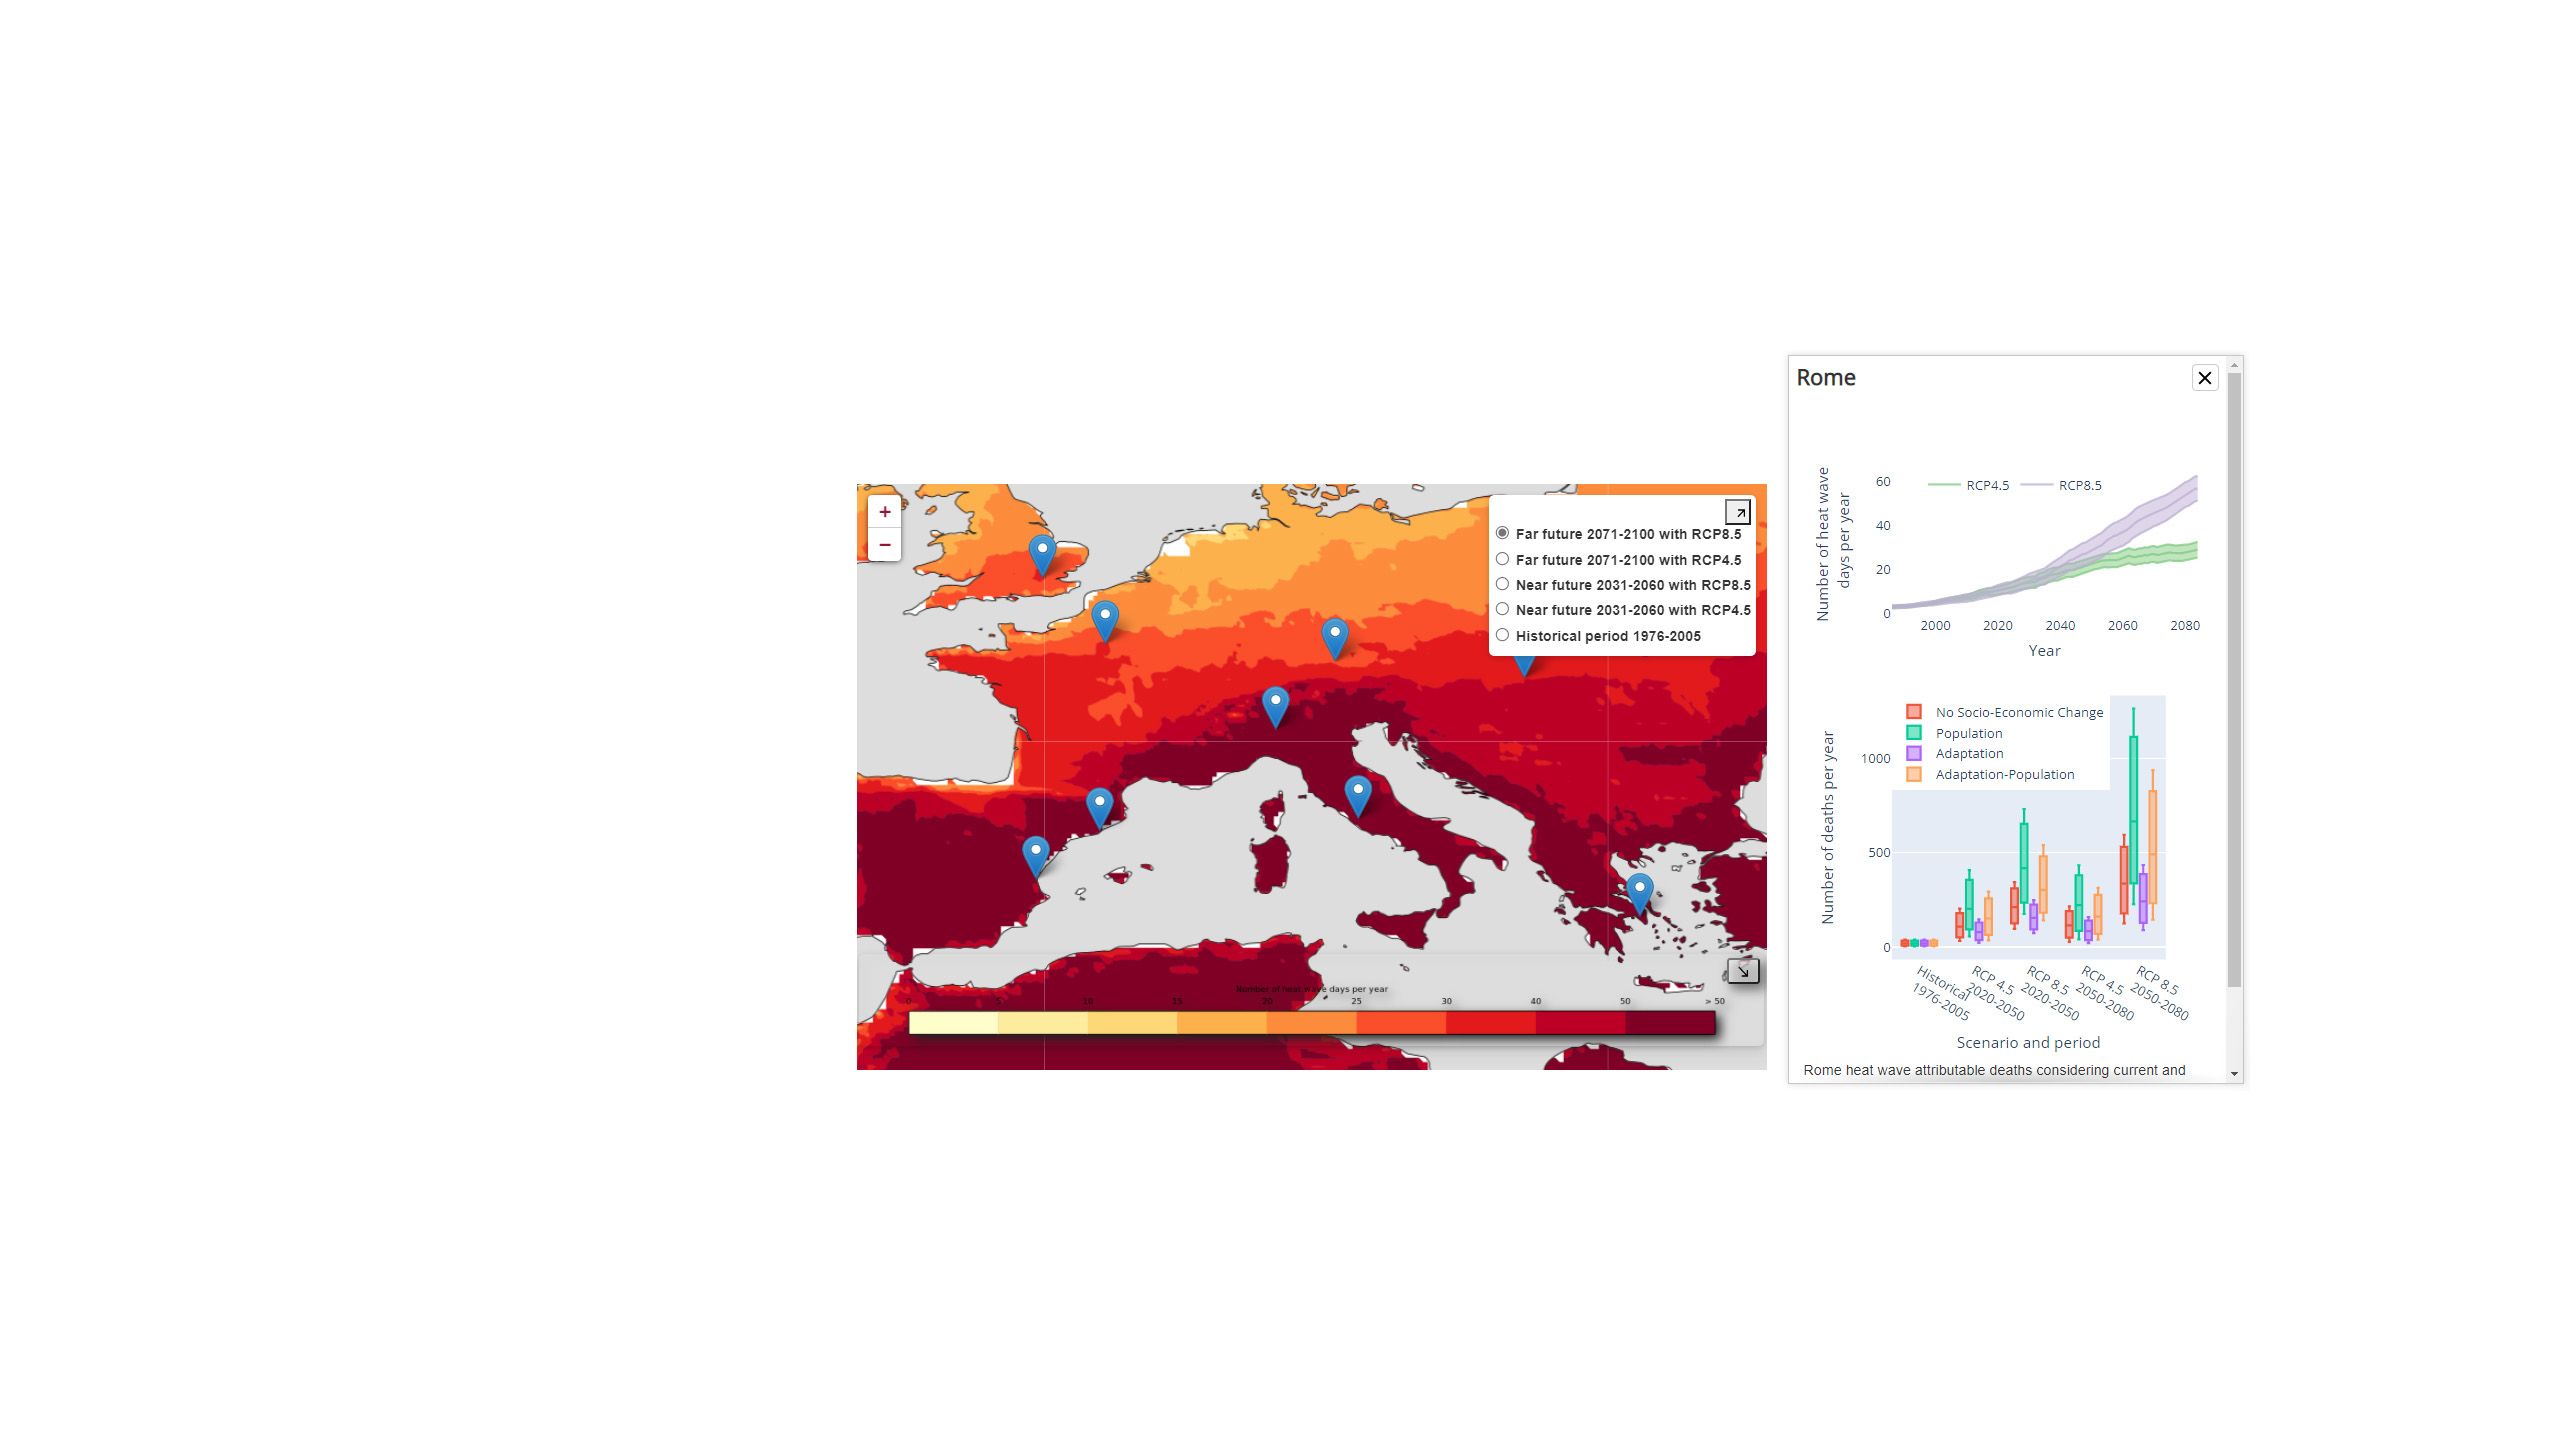
In the framework of C3S, the Flemish Institute of Technological Research (VITO) examined the expected impacts of climate change on heat-attributable deaths, under low- and high-carbon emission scenarios.
A C3S application on projected heatwaves is available through the CDS, showing the expected intensity of heatwaves across the continent in a future climate. The application shows that heat-related deaths in Europe are likely to increase, whether or not carbon emissions are reduced.
Certain Mediterranean cities, which are especially prone to the effects of harmful heatwaves, are particularly vulnerable to heat-related deaths. These include Barcelona and Valencia in Spain, and Milan and Rome in Italy.
This application can be used by urban planners and regional governments to assess the impacts of heatwaves.
Background: The number of heatwave days in the far future 2071-2100 under RCP8.5, the timeseries of heatwave days for Rome and projected number of heat-related deaths under different emission and socio-economic scenarios. Credit: Copernicus Climate Change Service, ECMWF.
The Lazio Regional Health Service
also used C3S data…
“We used these data in Italy in order to identify in the major cities which areas are most at risk […] and provide this data to GPs, local health authorities who actually implement the measures during heatwaves.”
Infectious diseases: the problem
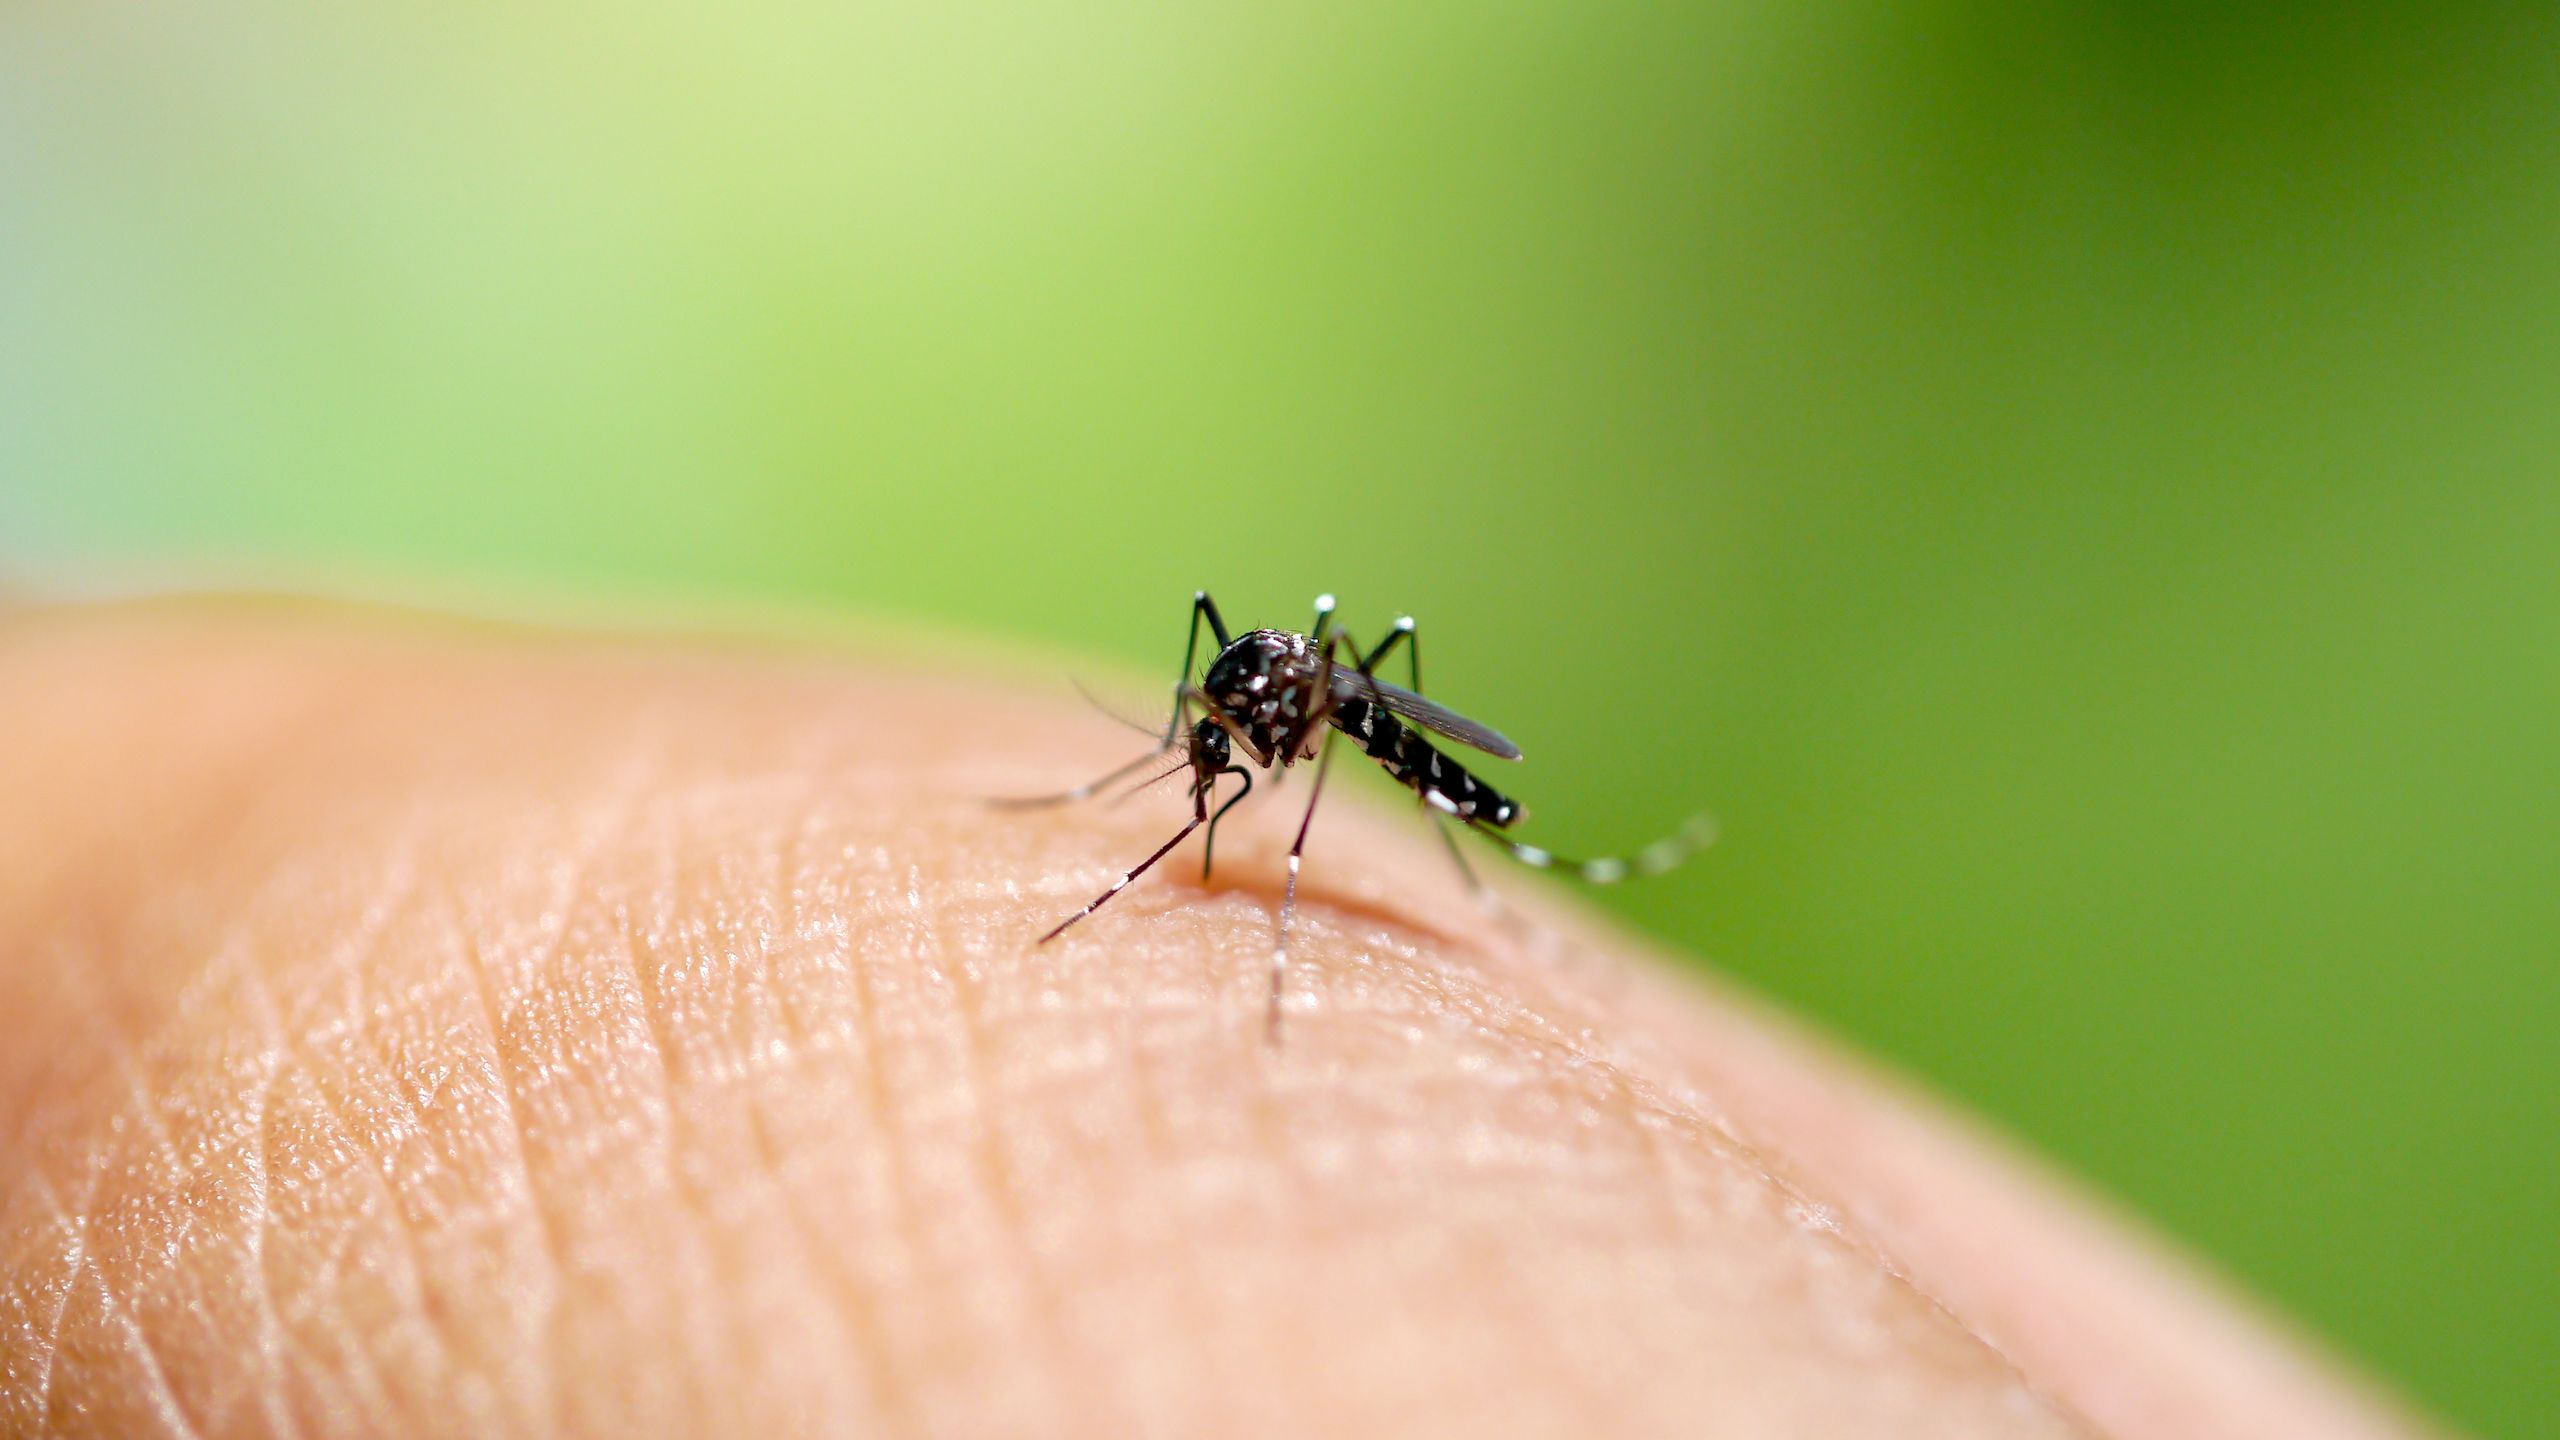
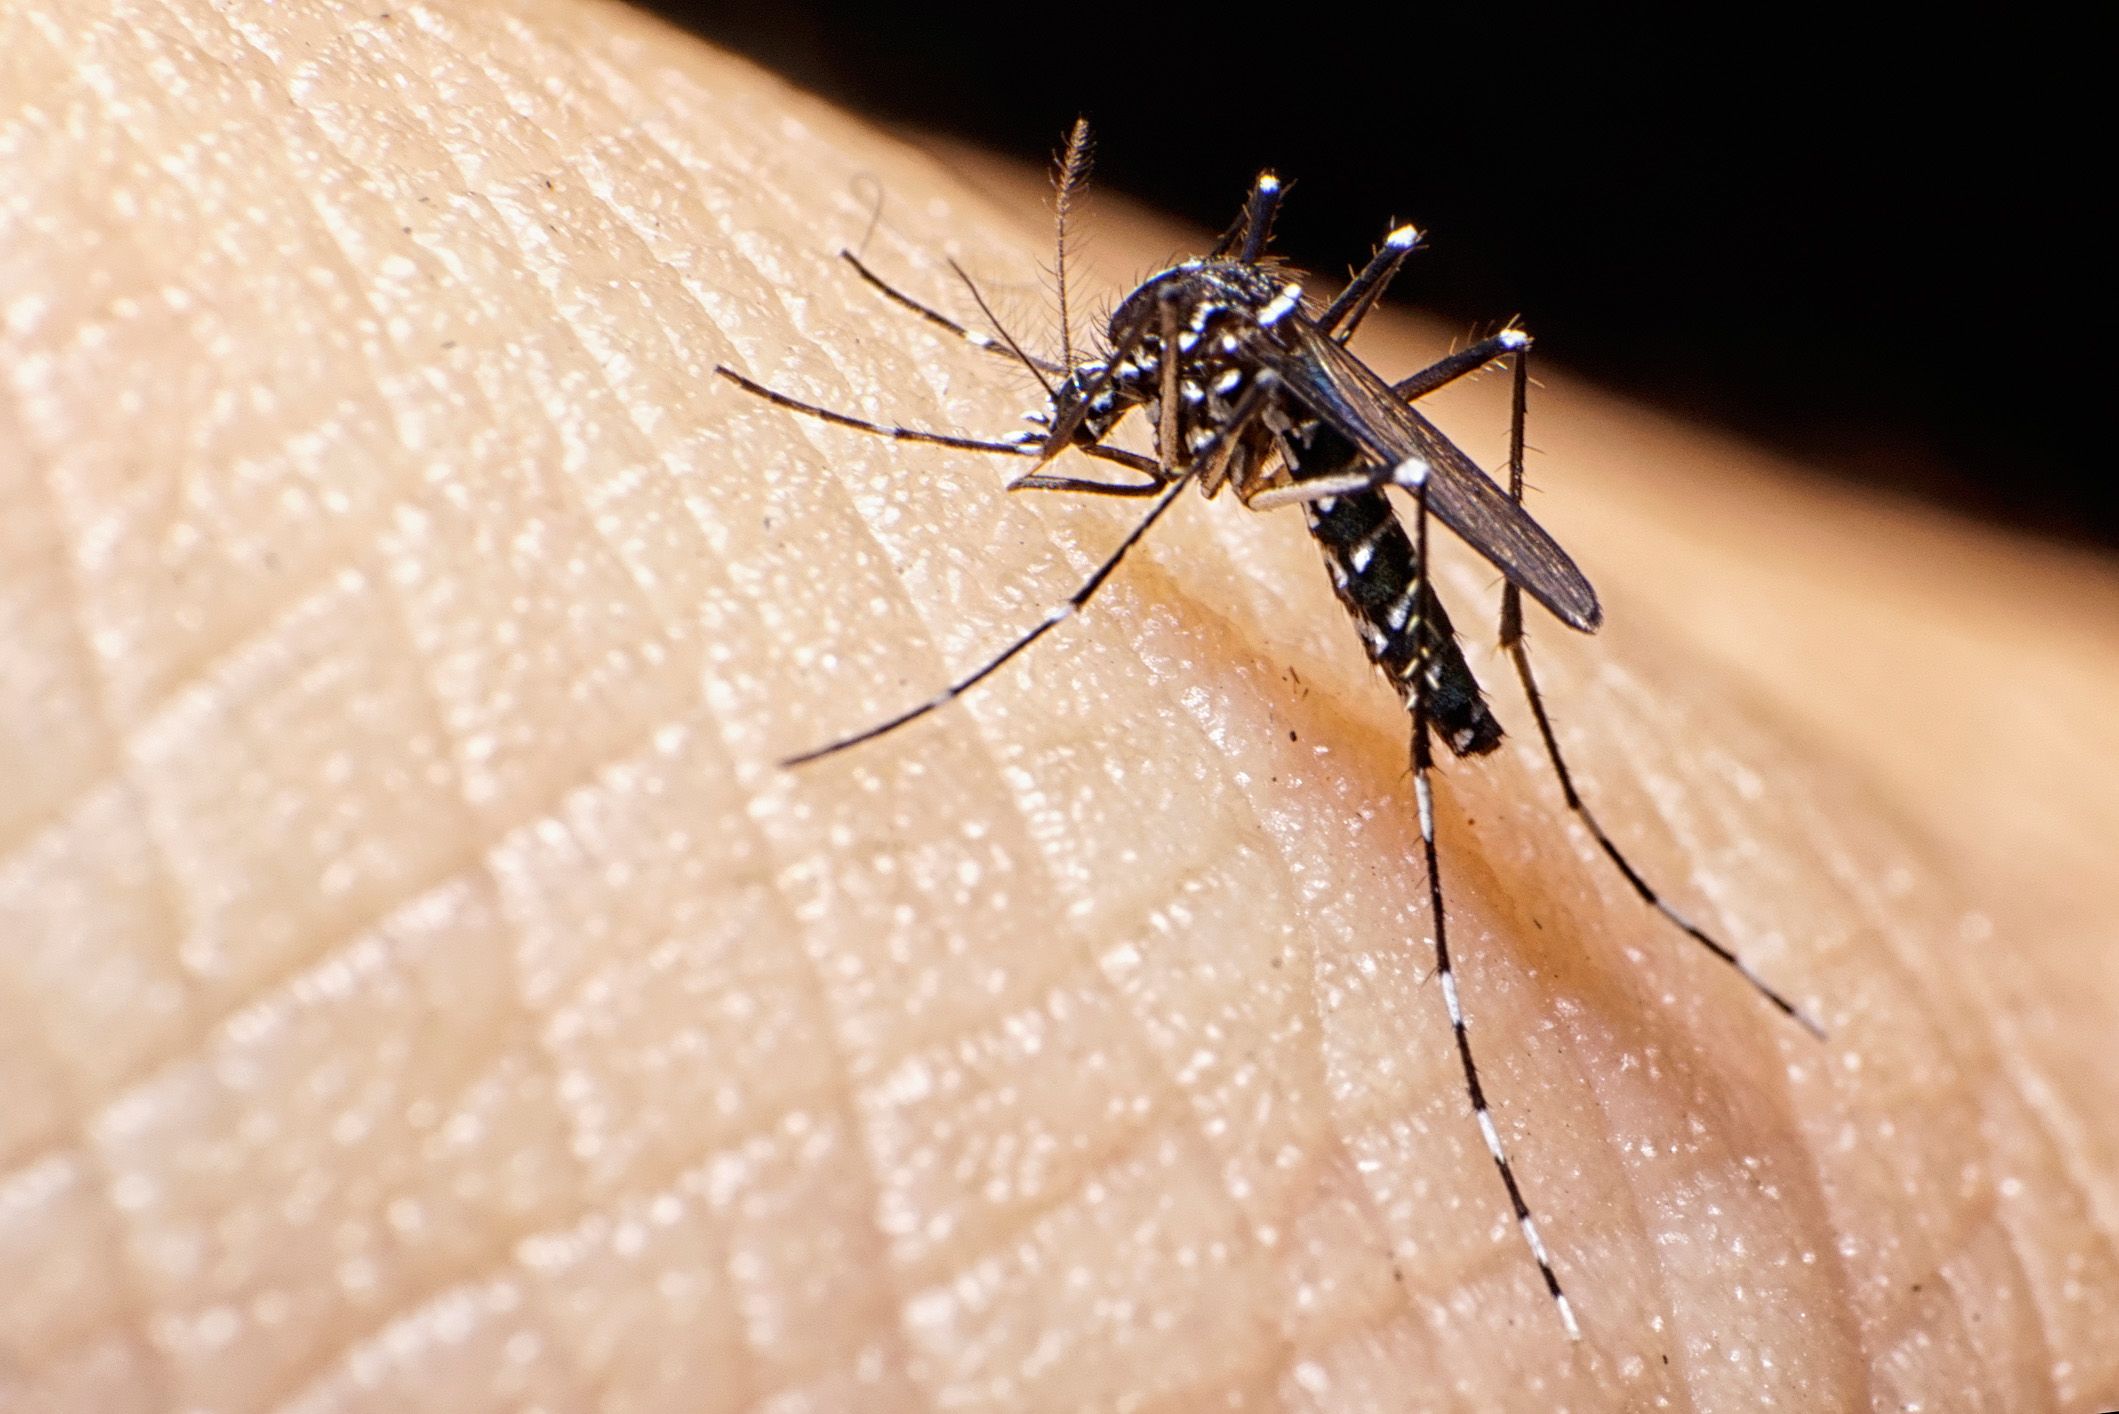
Rising temperatures are also linked to the spread of infectious diseases. Vectors such as mosquitos spread and breed in locations favourable to them, and as the climate changes their ranges are shifting.
Estimates suggest that mosquitos alone are responsible for 750 000 deaths worldwide each year. Dengue virus is thought to infect 96 million people worldwide annually, according to the World Health Organization. Over 3.9 billion people in more than 128 countries are at risk.
Many infectious diseases thrive in tropical and subtropical regions, and have long been associated with countries in the southern hemisphere. But climate change, land use alterations from agriculture and urban expansion, coupled with global trade and transport means that these diseases and their vectors are populating new areas.
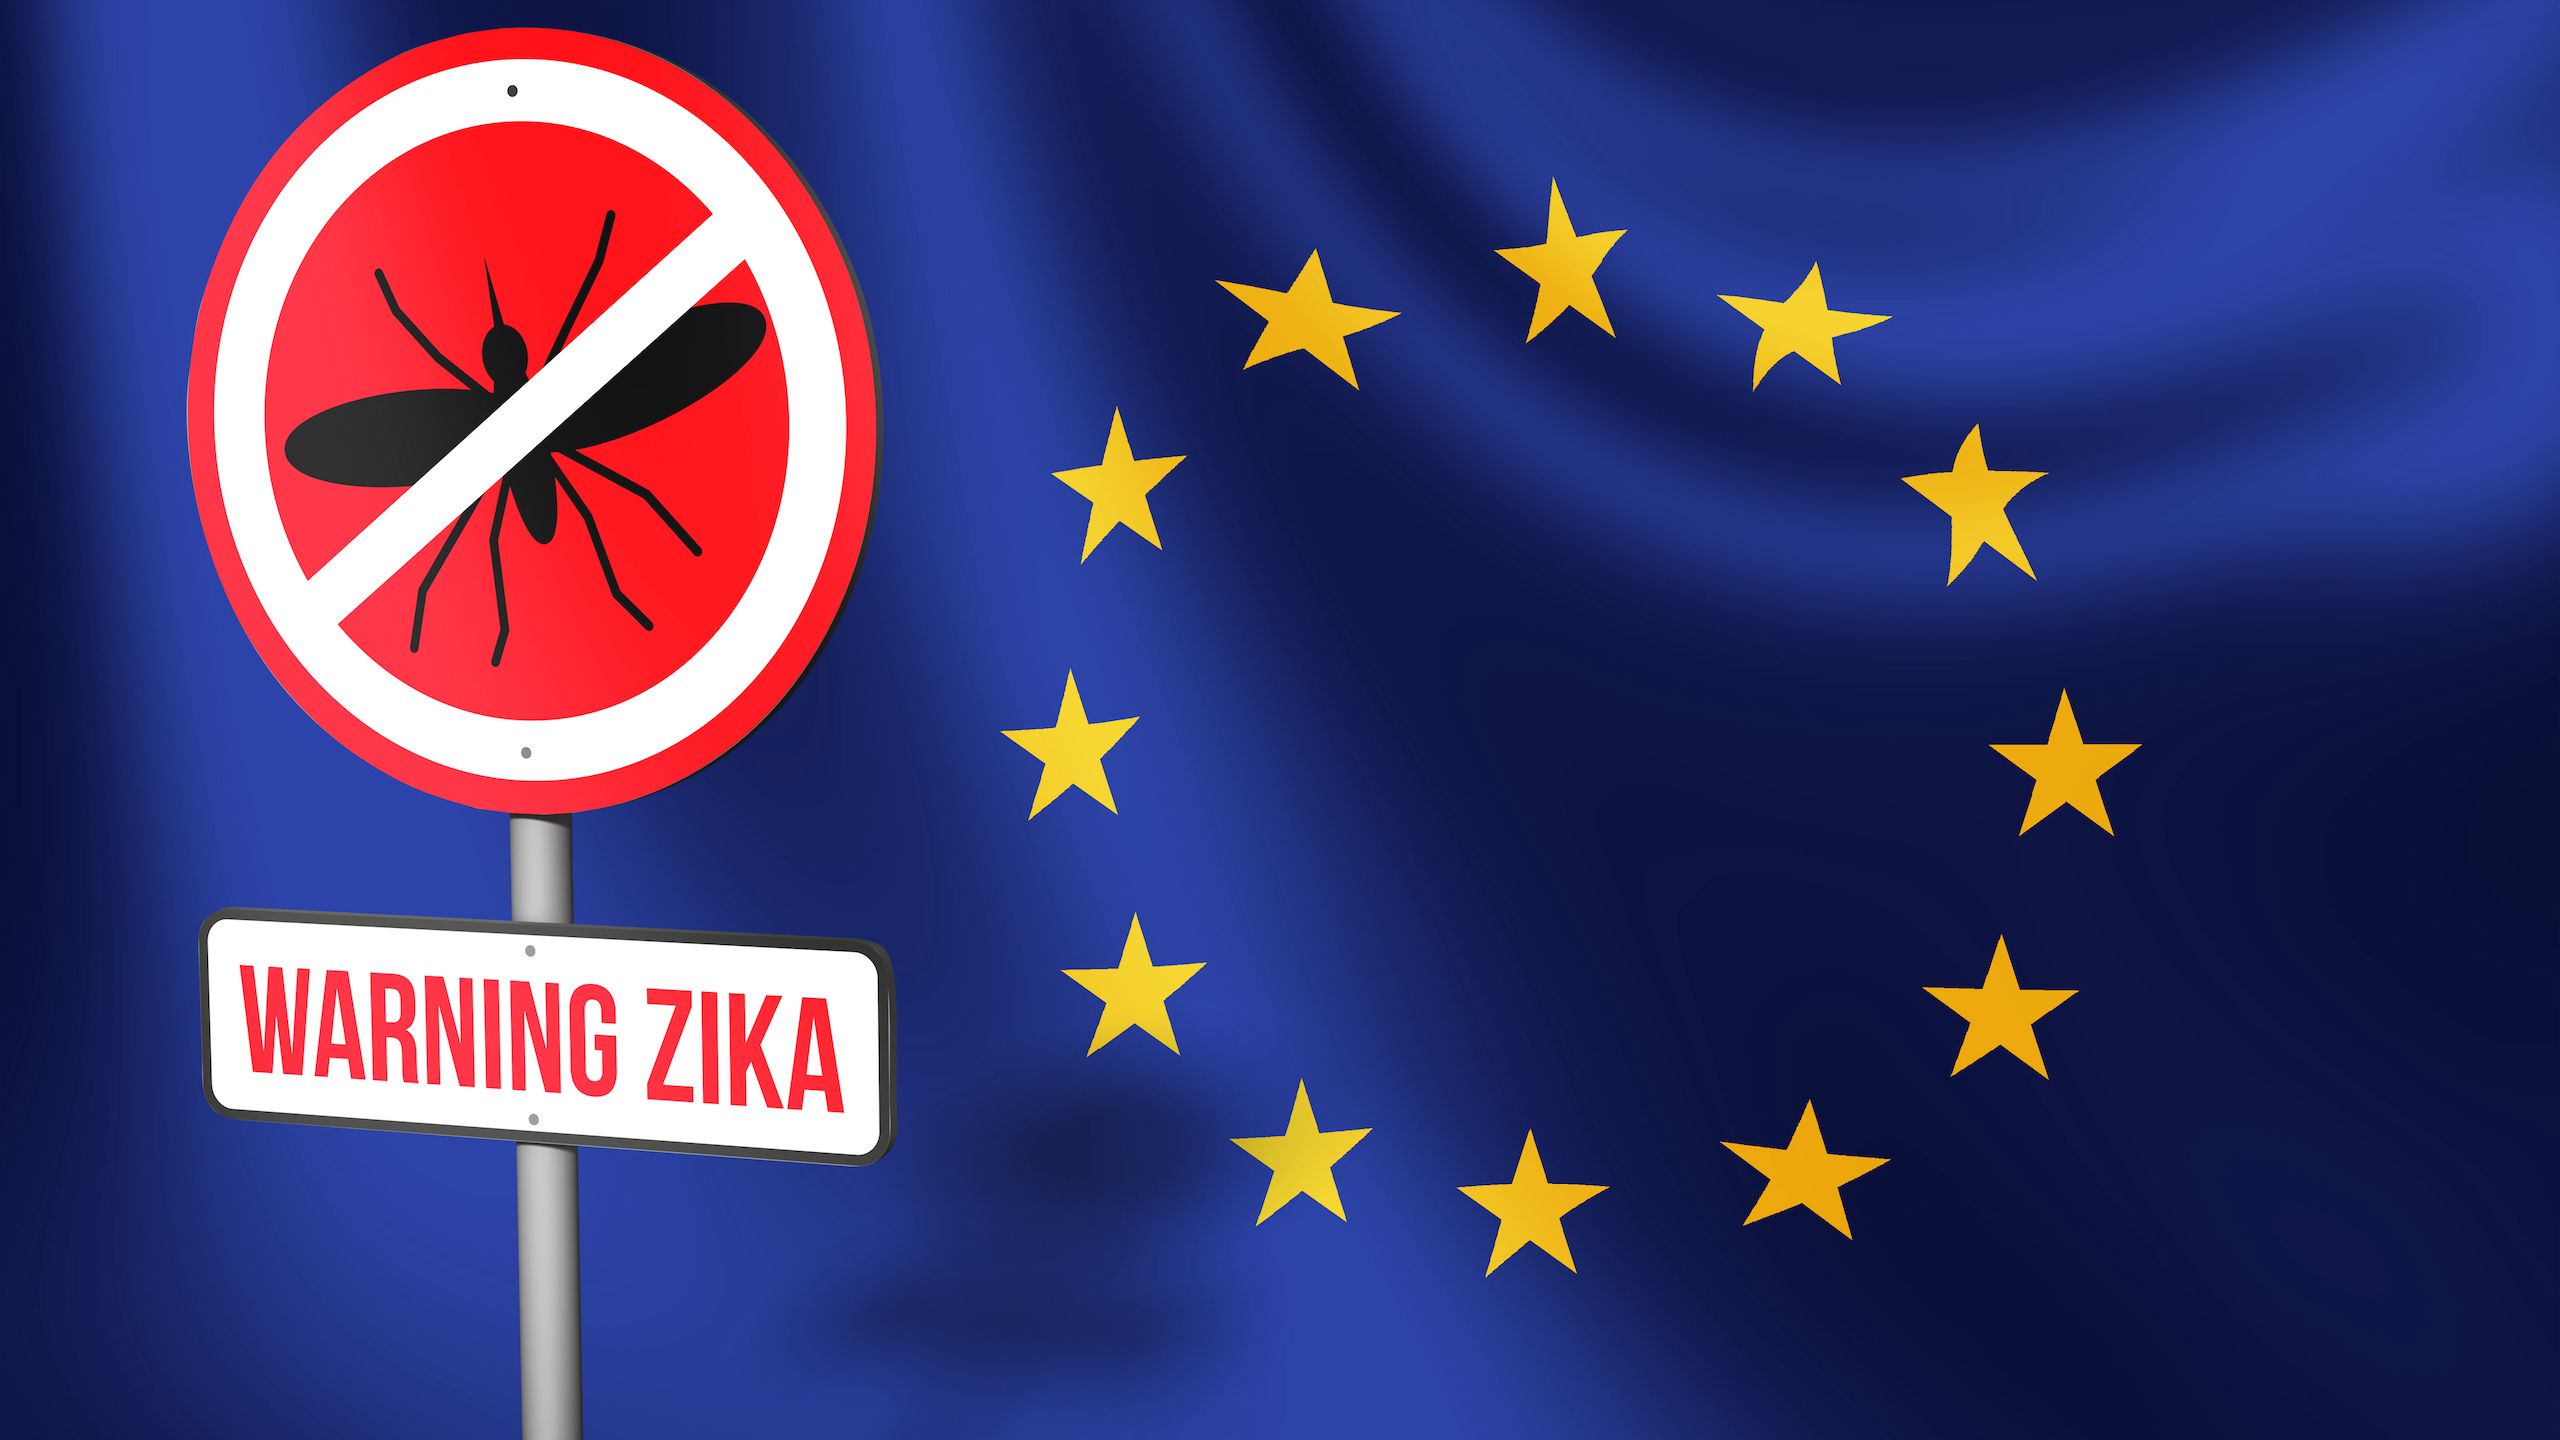
Chikungunya, dengue and Zika virus are the three fastest expanding diseases in the Northern Hemisphere. Dengue outbreaks have already occurred in southeastern Europe, and scientists are working to predict where other outbreaks may take place across the continent. Tiger mosquitos, native to the tropical and subtropical areas of southeast Asia are now found in cities such as Bologna and Rome. National and international strategies to combat this new and evolving risk depend on reliable, accurate modelling and monitoring.


Infectious diseases: solutions for monitoring and forecasting
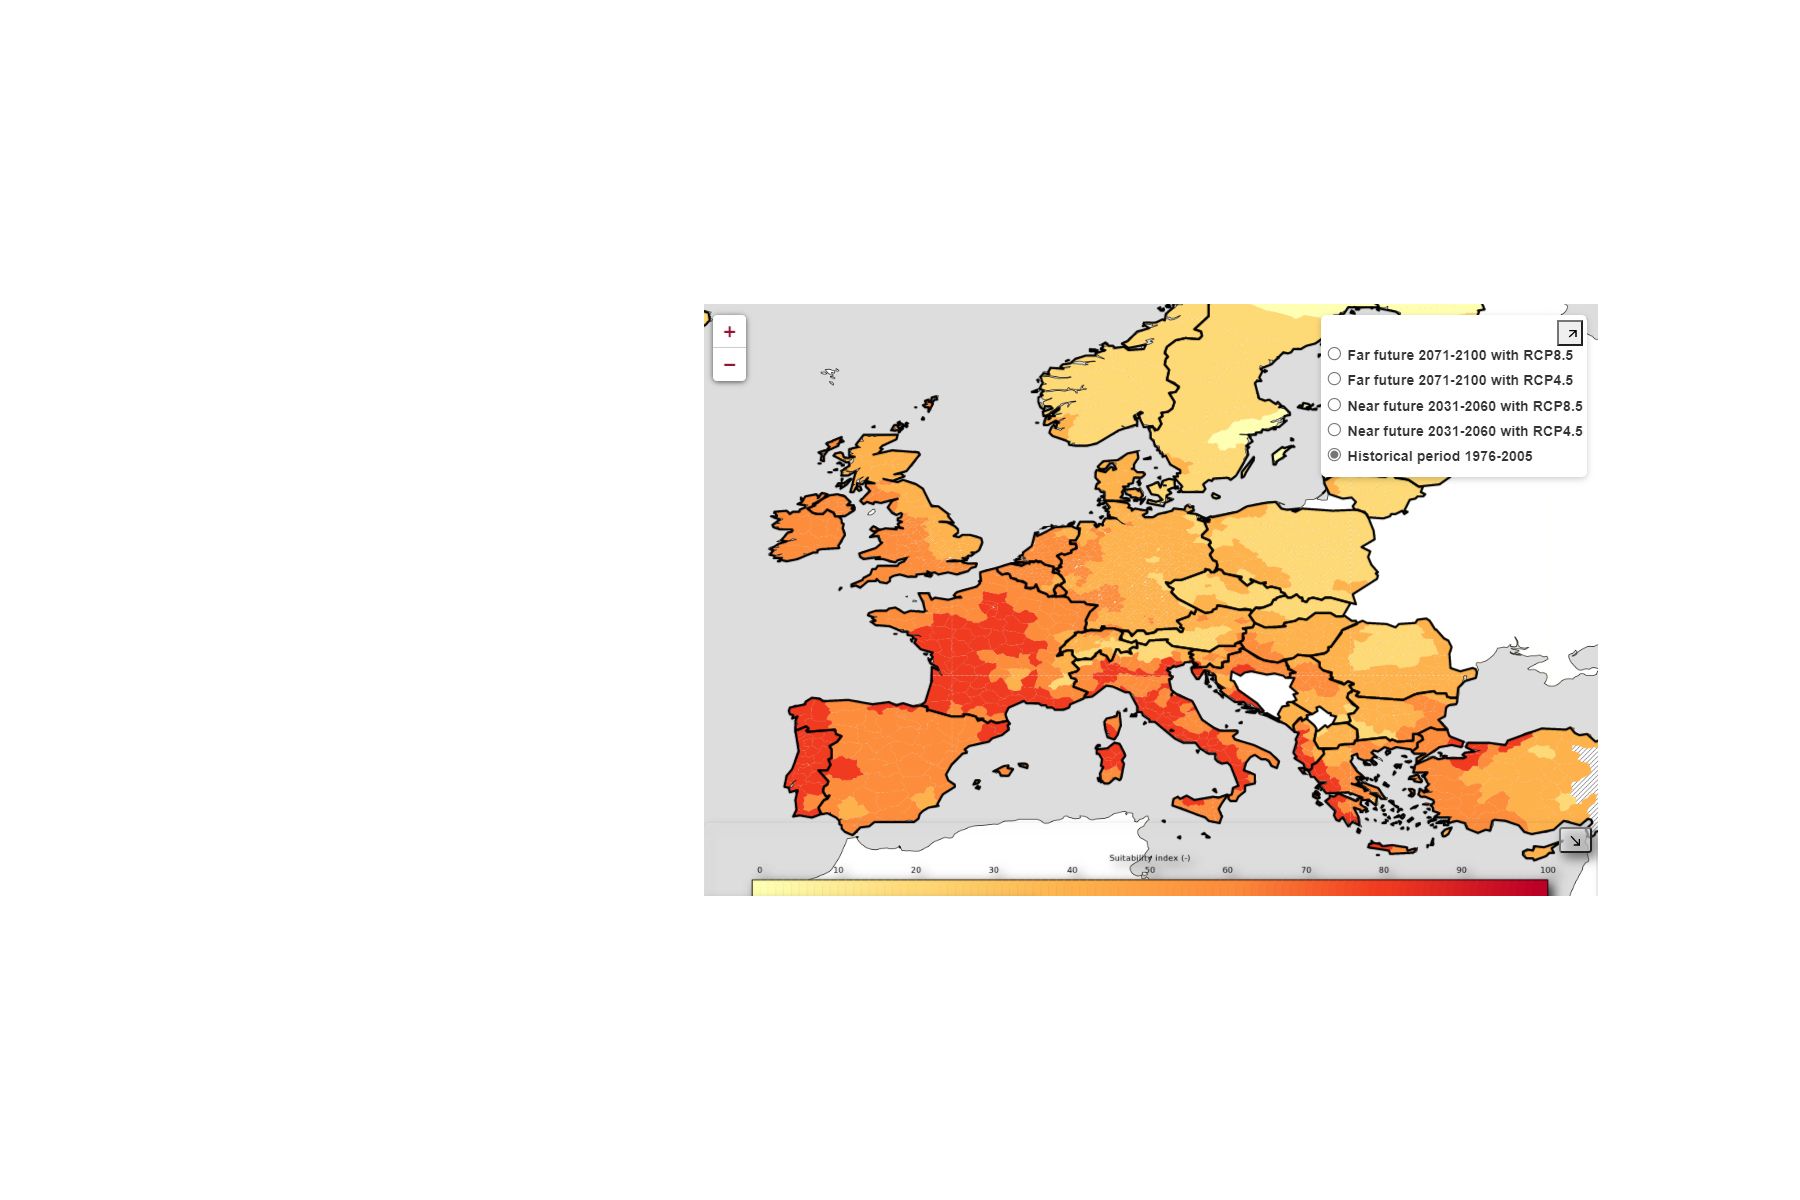
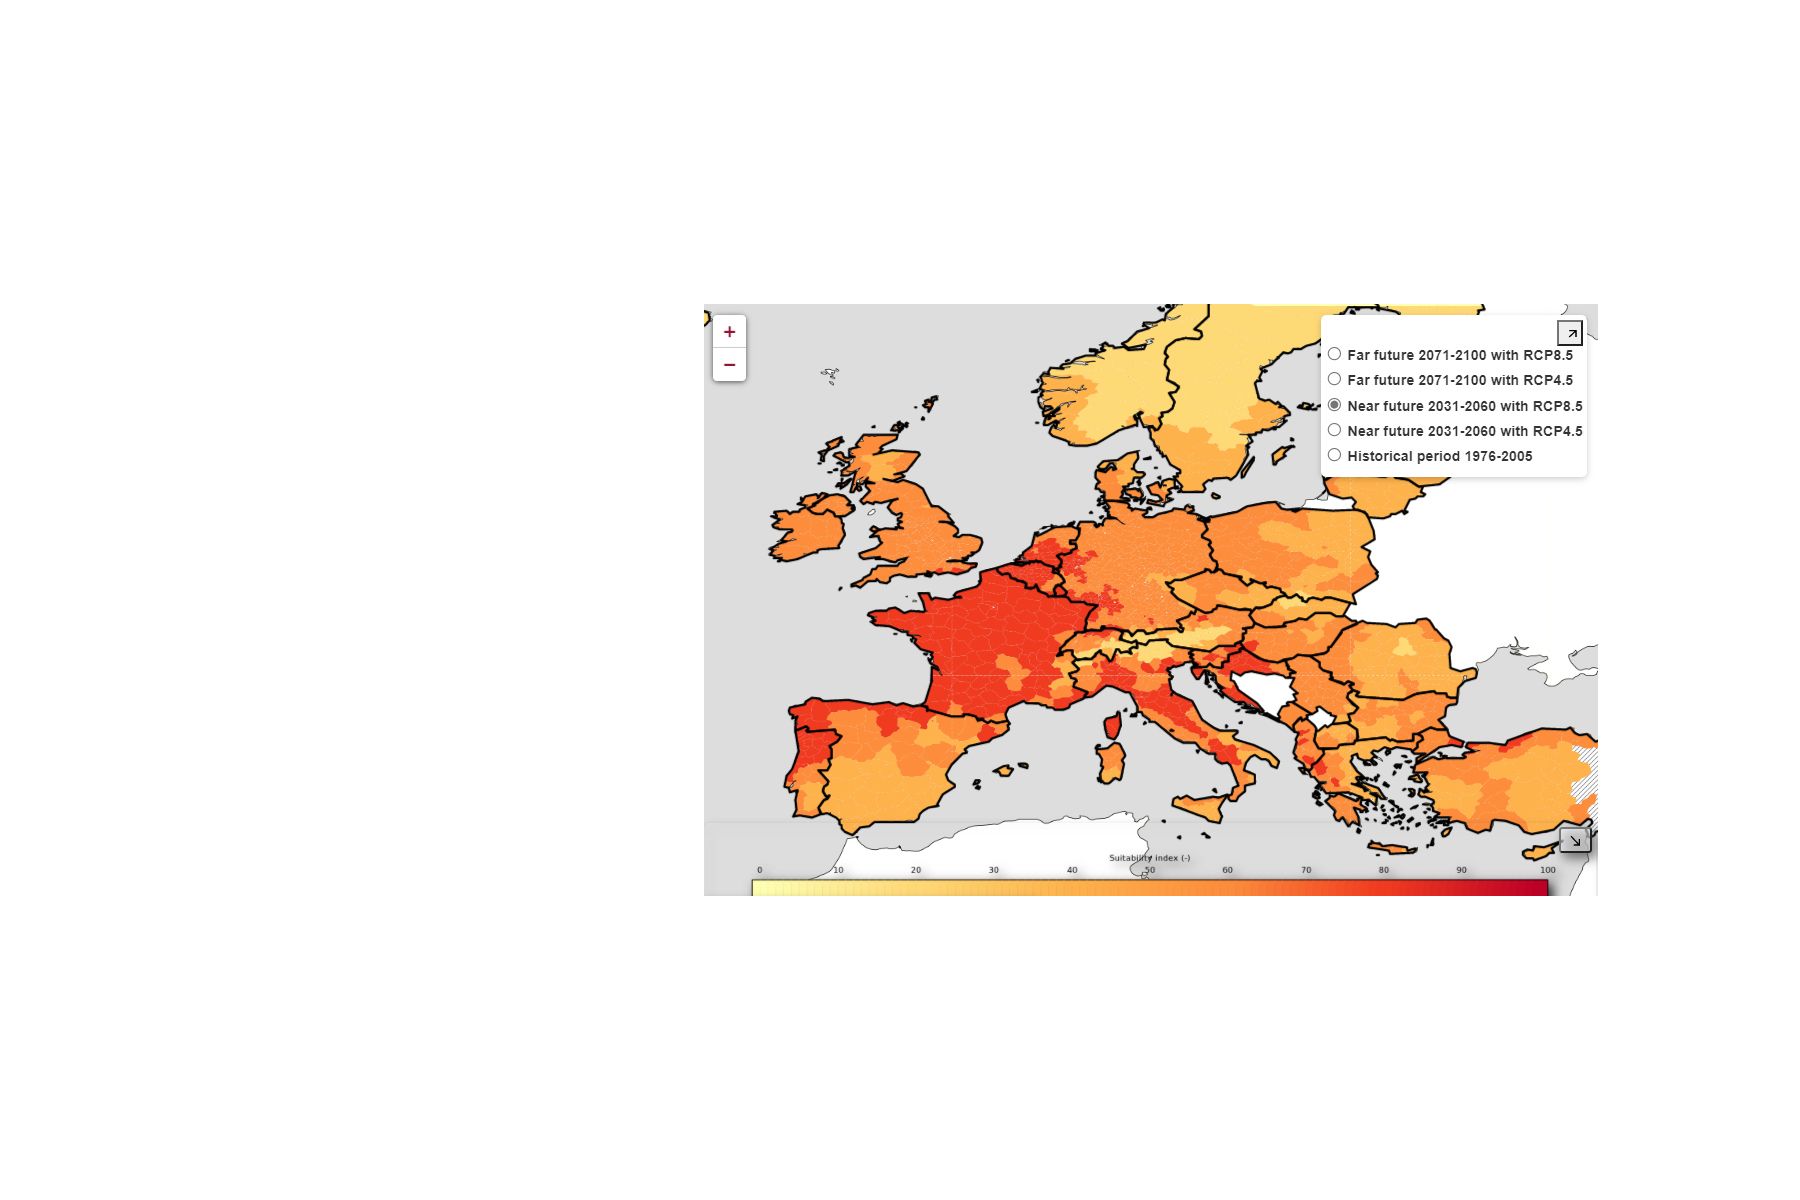
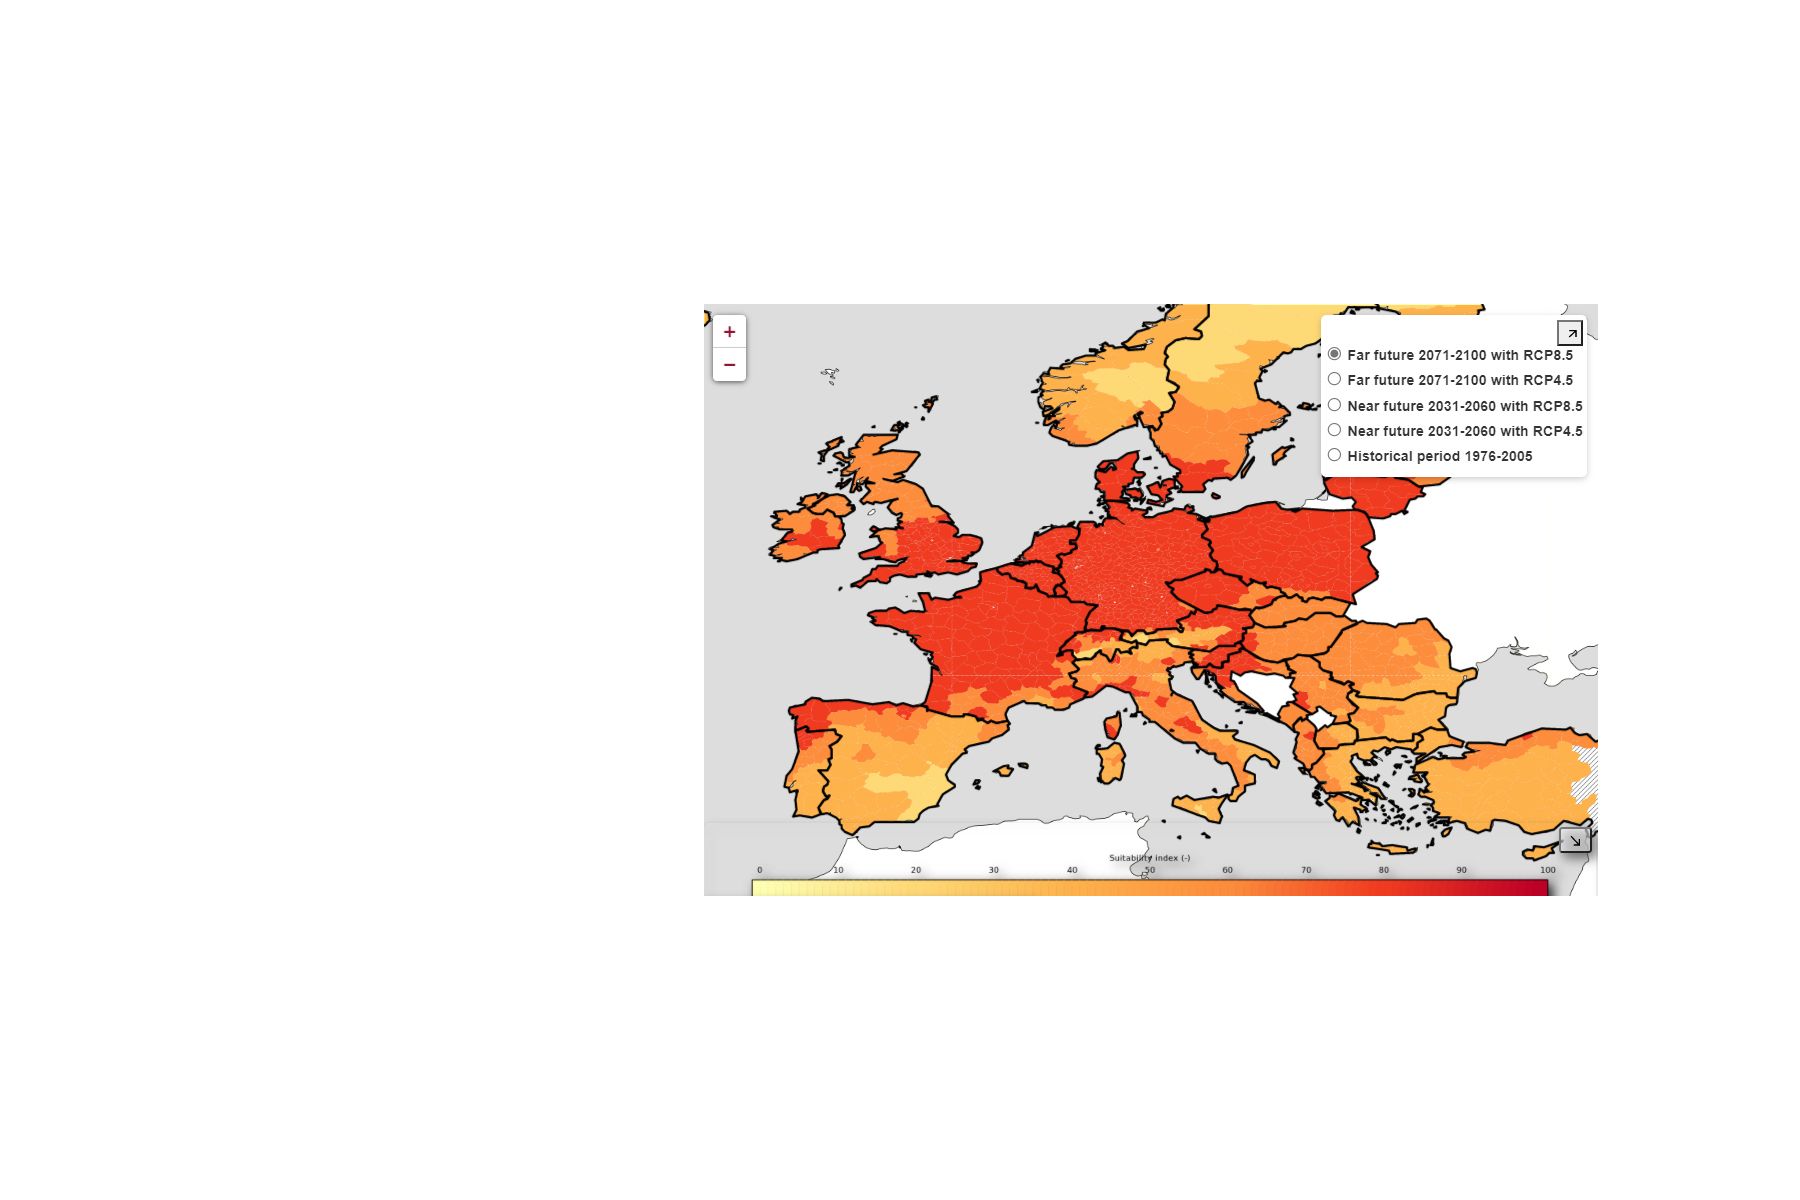
A C3S application shows how future climate conditions in Europe will change the suitability of the continent for the survival of the Aedes albopictus (Asian tiger mosquito) and the length of the season during which the mosquito can survive. These estimates are based on C3S data on temperature and precipitation, and were developed with the support of VITO.
Users can compare the past and different future periods and choose between different RCP scenarios to see how changes in human behaviour may impact the range of the Asian mosquito.
The images on the right show how climate change is likely to alter the suitability of Europe to the Asian tiger mosquito. The first map shows the average 1976–2005 suitability, the second shows the average 2031–2060 suitability, and the third shows the average 2071–2090 suitability.
Background: The suitability index for the Asian tiger mosquito in 1976–2005.
Credit: Copernicus Climate Change Service, ECMWF.
Background: The suitability index for the Asian tiger mosquito in 2031–2060, assuming an emissions scenario of RCP 8.5.
Credit: Copernicus Climate Change Service, ECMWF.
Background: The suitability index for the Asian tiger mosquito in 2071–2100, assuming an emissions scenario of RCP 8.5.
Credit: Copernicus Climate Change Service, ECMWF.
The results demonstrate that central and northern Europe are likely to become more suitable for the Asian tiger mosquitos to survive later in the 21st century.
The Cyprus institute also advanced on using ERA5 reanalysis and climate projections to support risk assessment of vector-borne diseases by the Aedes albopictus.
Reliable predictions of mosquito spread using C3S climate data will help improve healthcare and disease management strategies, and will hopefully eventually reduce the global burden of vector-borne disease. One strong user of the tool is Avia-GIS, a Belgian SME. Avia-GIS uses the data to know which locations should be monitored in the future and where local measurements should be made.
The European Centre for Disease Prevention and Control (ECDC) and C3S collaborated on enhancing their rapid risk assessments for diseases spread by mosquitos. An application allows them to link disease outbreaks with environmental conditions, based on C3S’ ERA5 reanalysis data.
“The C3S Climate Data Store provides us with a reliable and stable environment for building climate-based applications without the need for searching a whole range of weather repositories.”
COVID-19: the problem
As the coronavirus pandemic took hold in early 2020, interest increased in how the climate and air quality impact the virus. Understanding what factors influence the spread of COVID-19 would enable health authorities and governments to plan ahead and mitigate the impacts.
Whilst lockdown measures reduced the spread of COVID-19, they also decreased daily activities such as traffic and industry. CAMS data have been used to investigate the impact of lockdowns on air quality, as well as whether air quality impacts the spread or symptoms of COVID-19.
The public are aware that many viruses are seasonal – influenza, for example, returns in a slightly different form every winter. This seasonality occurs because the spread of certain viruses is impacted by climatic factors such as temperature and humidity. Would SARS-CoV-2 show the same pattern?

COVID-19: solutions for monitoring and forecasting
Realising that policymakers, researchers and the general public were increasingly interested in up-to-date information about the climate and atmosphere, CAMS and C3S both decided to present some of their COVID-19-relevant data in an accessible format.
Atmosphere data for COVID-19 research
Almost immediately after the pandemic hit Europe, CAMS built a dedicated website to support research into the link between COVID-19 and air quality.
The ‘CAMS COVID resource’ presents a variety of CAMS data, including maps showing surface concentrations of key air pollutants for the previous day. It also provides longer-term time series of surface concentrations; this information on how air pollution has evolved since the beginning of the outbreak is useful for assessing possible trends.
Comparing nitrogen oxide pollution over Europe during the first COVID-19 lockdown and during a ‘business as usual’ period. Credit: Copernicus Atmosphere Monitoring Service, ECMWF / BSC.
CAMS data have been used to:
· Develop an emissions inventory for the periods before and after lockdown began. Data collected from different countries and sectors will help in understanding the impacts of the COVID-19 pandemic on air quality.
· Assess the links between meteorological and air quality factors, and COVID-19 transmission. The review found that transmission is impacted far more by government-dictated measures, such as mask-wearing or travel restrictions, than by weather or air quality.
· Data have been used to study how a respiratory system damaged by air pollution may impact how severely a person is affected if they contract COVID-19. Research in this area will take many months or years as large groups of people need to be studied for a long time period.
“We warmly welcomed the close cooperation between the EEA and CAMS on the production of this EEA flagship report on Air Quality. The CAMS information on atmospheric pollutants effectively complements official EEA monitoring data to provide a robust picture of the impact of lockdowns on air quality across Europe. The cooperation delivered valuable insights of relevance for air quality policies, presented in this report.”

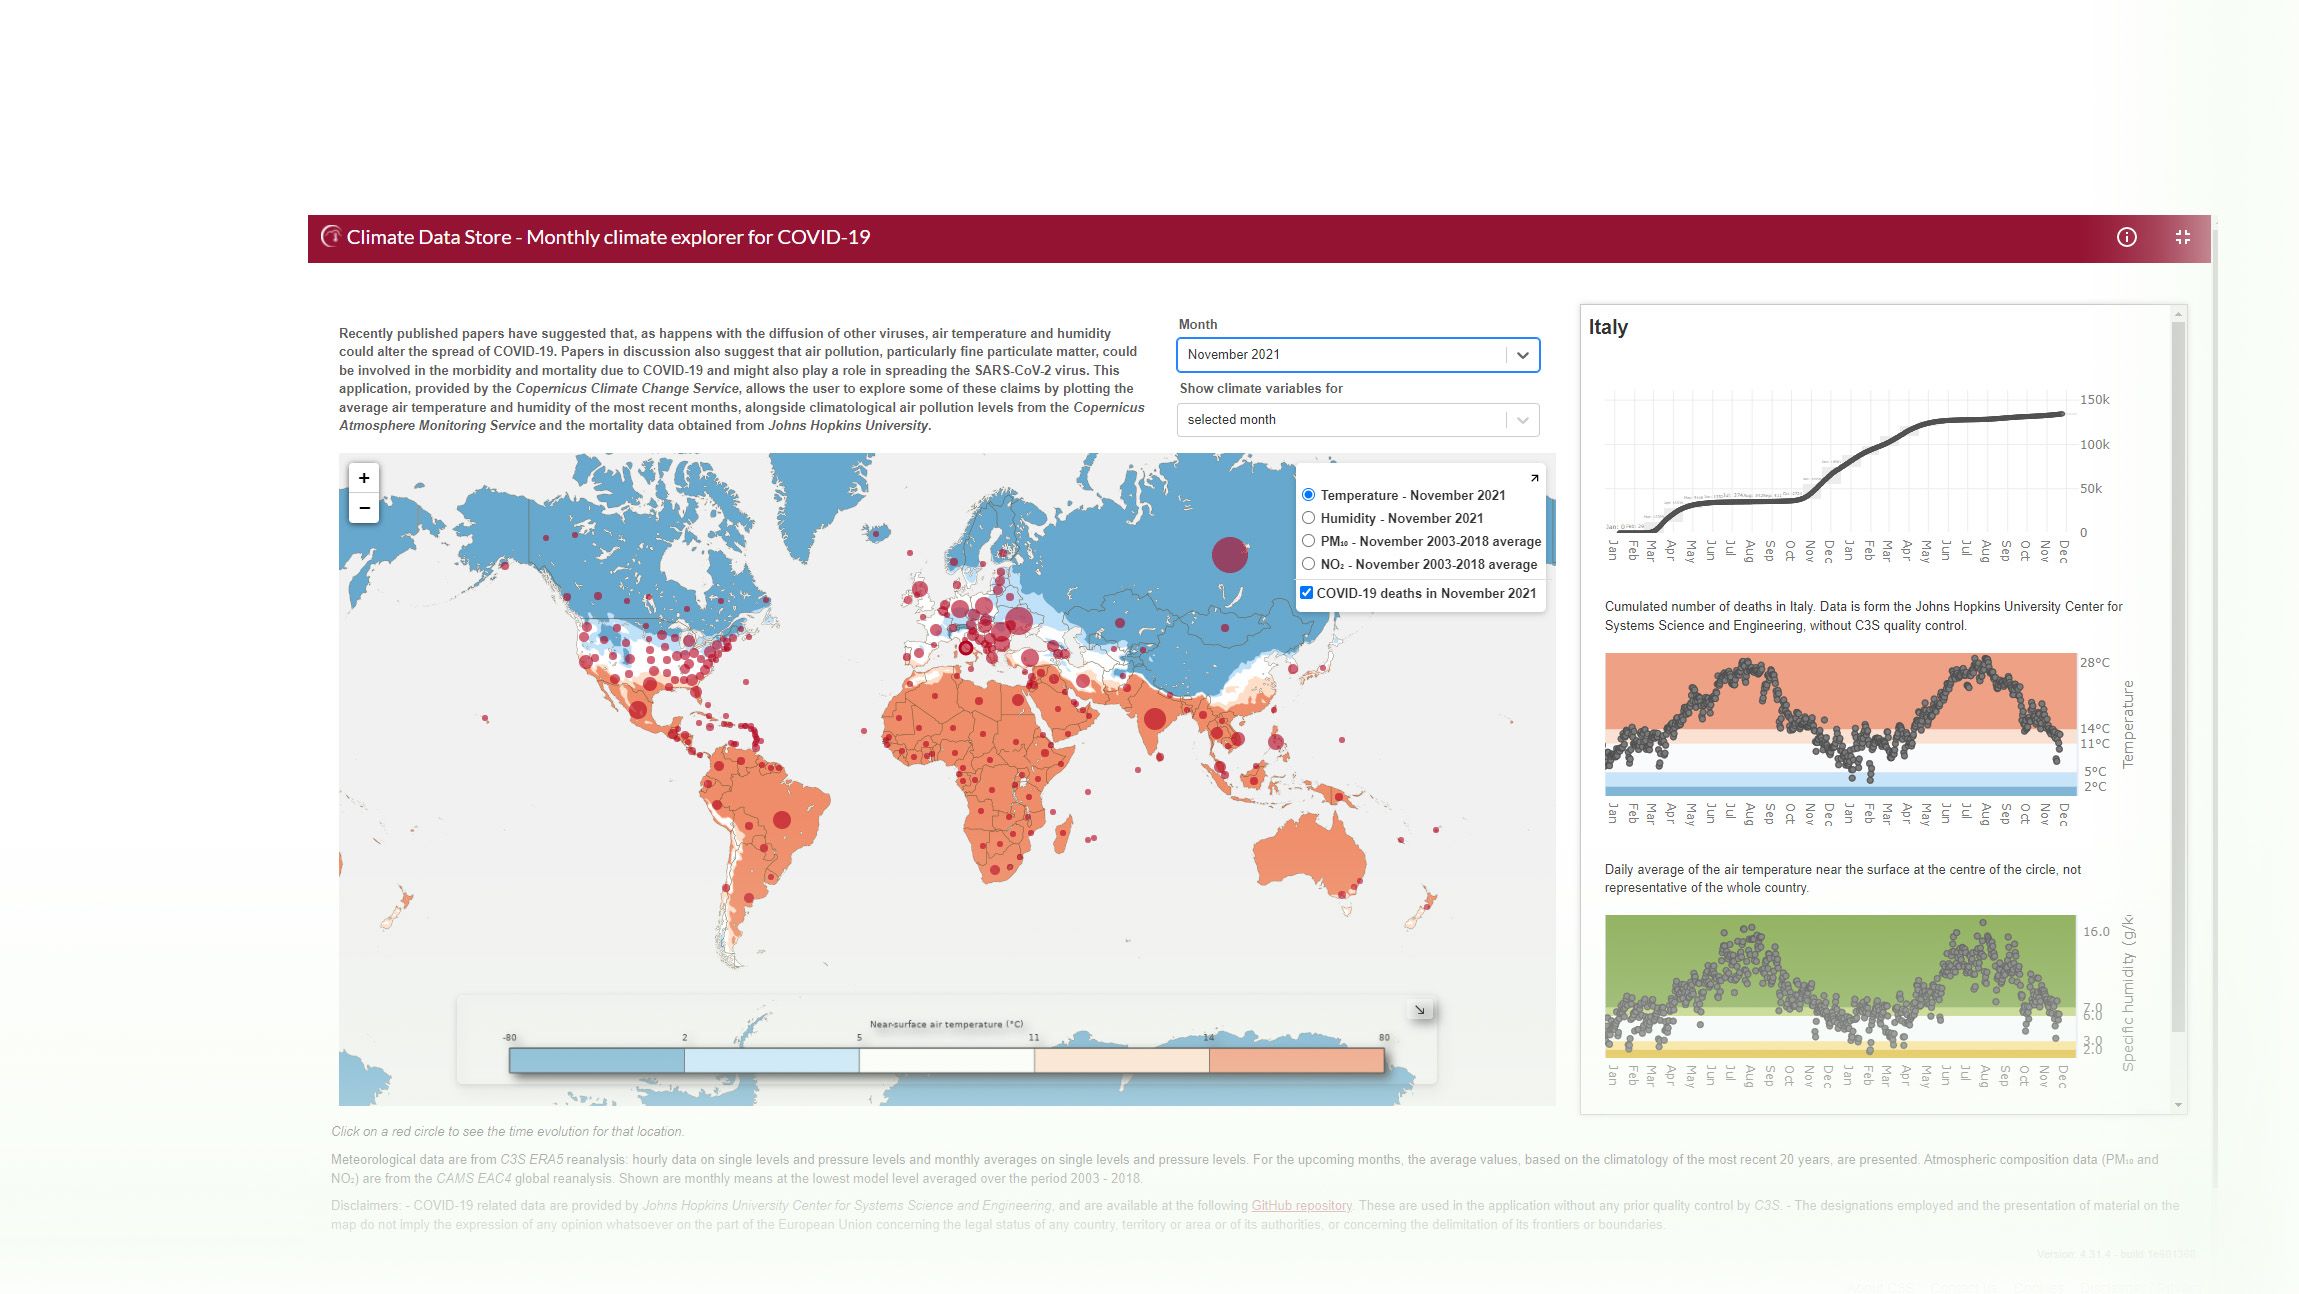
Climate and atmosphere data for COVID-19 research
Outbreaks of viral respiratory diseases often show a seasonal cycle, leading researchers to consider whether COVID-19 might show a similar pattern. With this in mind, C3S and CAMS developed the ‘Monthly Climate Explorer for COVID-19’ made available through the CDS. The application allows users to explore possible connections between COVID-19 mortality rates, air pollution data, and temperature and relative humidity. The climatological variables are based on C3S' ERA5 reanalysis data.
Background Image: Visusalisation of climate and atmosphere parameters and COVID-19 deaths in the Monthly Climate Explorer for COVID-19. Credit: Copernicus Climate Change Service, ECMWF.
Conclusion: Harnessing the power of Copernicus data
The world faces unprecedented and evolving challenges over the next century. The need to reliably monitor the atmosphere and climate system, and predict its future, has never been greater. The sustainable transition of urban landscapes, transport, trade and agriculture will all be essential if we are to reach the ambitious Sustainable Development Goals (SDGs) goals set out by the UN. In the area of public health (SDG 3) we work to reduce death and illness stemming from pollution, tropical diseases and rapid urbanisation.
There is a pressing need to transform cities to be resilient to climate change, greener and healthier, while understanding that more humans are migrating to urban centres each year. The health impacts of urban life in a changing climate, caused by heat stress, weather extremes and poor air quality, are being understood with the power of Copernicus data, tools and services. Emerging diseases, both air- and insect-borne, are also monitored with the help of these services.
As policymakers, decisions businesses, local organisations and citizens all work to create a more sustainable and safer future, CAMS and C3S will support these efforts and empower bold choices to ensure their success. On the one hand some users of CAMS and C3S data may need high-level easy-to-access information in the form of health-related apps, while other more discerning users can leverage the added value of the various datasets in comprehensive analyses. It is the synergy and cooperation between these users that fuels innovation in public health and climate change.